Export Fall Once again in Jan, Imports Static but Crude, Capital
Goods Rise while Official Gold Falls
[MoC&I Press Release dated 14th
February 2020]
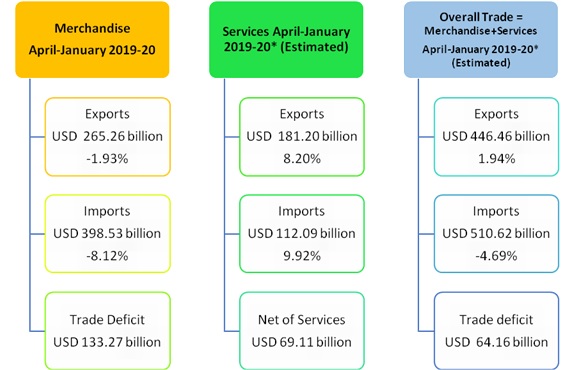
India’s overall exports (Merchandise and Services combined) in
April-January2019-20* are estimated to be USD 446.46 billion, exhibiting a positive growth of 1.94 per cent over the same period last
year. Overall imports in April-January 2019-20* are estimated to be USD 510.62
billion, exhibiting a negative growth of (-)4.69 per
cent over the same period last year.
*Note: The latest data for services sector released by RBI
is for December 2019. The data for January2020 is an estimation, which will be
revised based on RBI’s subsequent release.
I. Merchandise Trade
Exports (including re-exports)
Exports inJanuary2020 were USD25.97 billion,
as compared to USD26.41 billion in January 2019, exhibiting a negative growth
of (-) 1.66 per cent. In Rupee terms, exports were Rs.
1,85,204 crore in January2020, as compared to Rs. 1,86,801.37 crore in January2019, registering a
negative growth of (-) 0.86 per cent.
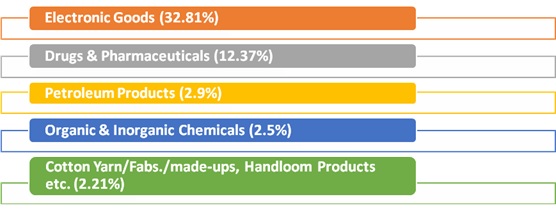
In January2020, major commodity groups of export showing positive growth over the corresponding month of last year
are
Cumulative value of exports for the period April-January
2019-20 was USD265.26 billion (Rs.18,69,762.61 crore)
as against USD270.49 billion (Rs.18,89,062.68 crore) during the period
April-January 2018-19, registering a negative growth of (-) 1.93per cent in
Dollar terms (negative growth of (-) 1.02 per cent in Rupee terms).
Non-petroleum and Non Gems and Jewellery
exports in January 2020 were USD19.79 billion, as compared to USD19.94 billion
in January2019, exhibiting a negative growth of (-) 0.78 per cent.
Non-petroleum and Non Gems and Jewellery exports in
April-January 2019-20 were USD197.60billion, as compared to USD197.59 billion
for the corresponding period in 2018-19.
Imports
Imports in January2020 were USD41.14 billion (Rs.2,93,418.56 crore), which was 0.75 per cent lower in Dollar
terms and 0.07 per cent higher in Rupee terms over imports of USD41.46 billion
(Rs 2,93,225.37 crore) in January2019. Cumulative
value of imports for the period April-January 2019-20 was USD398.53 billion
(Rs.28,08,202.38 crore), as against USD433.77 billion
(Rs.30,30,317.38 crore) during the period April-January 2018-19, registering a
negative growth of (-)8.12per cent in Dollar terms (negative
growth of (-)7.33 per cent in Rupee terms).
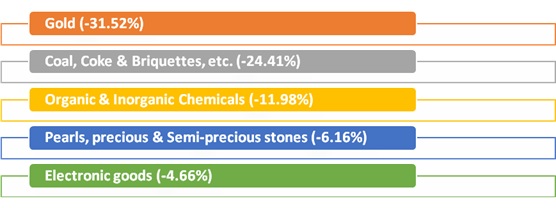
Major commodity groups of import showing negative growth in
January2020 over the corresponding month of last year are:
Crude Oil and Non-Oil Imports:
Oil imports inJanuary2020 were USD12.97 billion
(Rs. 92,502.86 crore), which was 15.27 percenthigher in Dollar terms (16.21 percent higher in Rupee
terms), compared to USD11.25 billion (Rs. 79,596.67
crore) in January2019. Oil imports in April-January 2019-20 were USD108.66
billion (Rs. 7,65,950.42
crore) which was 9.24 per cent lower in Dollar terms (8.53 percent lower in
Rupee terms) compared to USD119.72 billion (Rs.
8,37,369.22 crore), over the sameperiod last year.
In this connection it is mentioned that the global Brent
price ($/bbl) has increased by 7.31% in January2020
vis-à-vis January2019 as per data available from World Bank.
Non-oil imports inJanuary2020 were estimated at USD28.17
billion (Rs. 2,00,915.70
crore) which was 6.72 per cent lower in Dollar terms (5.95 percent lower in
Rupee terms), compared to USD30.20 billion (Rs.
2,13,628.70 crore) in January2019. Non-oil imports in April-January 2019-20
were USD289.87 billion (Rs. 20,42,251.96
crore) which was 7.70 per cent lower in Dollar terms (6.87percent lower in
Rupee terms), compared to USD314.04 billion (Rs.
21,92,948.16crore) in April-January2018-19.
Non-Oil and Non-Gold imports wereUSD26.59 billion in
January2020, recording a negative growth of (-)4.66
per cent, as compared to Non-Oil and Non-Gold importsof
USD 27.89 billion in January2019. Non-Oil and Non-Gold imports wereUSD265.23
billion in April-January 2019-20, recording a negative growth of (-)7.59 per cent, as compared to Non-Oil and Non-Gold importsUSD 287.00 billion in April-January 2018-19.
II. Trade in Services
Exports (Receipts)
As per the latest press release by RBI dated 14thFebruary
2020, exports in December2019 were USD 20.00 billion (Rs.
1, 42,413.68 crore) registering a positive growth of
11.59 per cent in dollar terms, vis-à-vis December2018. The estimated value of
services export for January2020* is USD 20.92 billion.
Imports (Payments)
As per the latest press release by RBI dated 14th February 2020, imports in
December 2019 were USD 12.56 billion (Rs. 89,382.31
crore) registering a positive growth of 10.36 per cent in dollar terms,
vis-à-vis December 2018. The estimated value of service Import for January2020*
is USD 13.10 billion.
III. Trade Balance
Merchandise: The trade deficit for January2020 was estimated at USD15.17billion as against the deficit of
USD15.05billion inJanuary2019.
Services: As per RBI’s Press Release dated 14th February 2020, the trade balance
in Services (i.e. Net Services export) for December, 2019 is estimated at
USD7.45 billion.
Overall Trade Balance: Taking
merchandise and services together, overall trade deficit for April-January
2019-20* is estimated at USD64.16billion as compared to USD97.79billion in
April-January 2018-19.
*Note: The latest data for services sector released by RBI
is for December 2019. The data for January2020 is an estimation, which will be
revised based on RBI’s subsequent release.
MERCHANDISE TRADE
|
(Provisional) |
||
|
|
JANUARY |
APRIL-JANUARY |
|
Exports
(including re-exports) |
|
|
|
2018-19 |
26.41 |
270.49 |
|
2019-20 |
25.97 |
265.26 |
|
%Growth
2019-20/ 2018-19 |
-1.66 |
-1.93 |
|
Imports |
|
|
|
2018-19 |
41.46 |
433.77 |
|
2019-20 |
41.14 |
398.53 |
|
%Growth
2019-20/ 2018-19 |
-0.75 |
-8.12 |
|
Trade
Balance |
|
|
|
2018-19 |
-15.05 |
-163.27 |
|
2019-20 |
-15.17 |
-133.27 |
|
Exports
& Imports: (Rs. Crore) |
||
|
(Provisional) |
||
|
|
JANUARY |
APRIL-JANUARY |
|
Exports
(including re-exports) |
|
|
|
2018-19 |
1,86,801.37 |
18,89,062.68 |
|
2019-20 |
1,85,204.00 |
18,69,762.61 |
|
%Growth
2019-20/ 2018-19 |
-0.86 |
-1.02 |
|
Imports |
|
|
|
2018-19 |
2,93,225.37 |
30,30,317.38 |
|
2019-20 |
2,93,418.56 |
28,08,202.38 |
|
%Growth
2019-20/ 2018-19 |
0.07 |
-7.33 |
|
Trade
Balance |
|
|
|
2018-19 |
-1,06,424.00 |
-11,41,254.70 |
|
2019-20 |
-1,08,214.56 |
-9,38,439.77 |
SERVICES TRADE
|
EXPORTS &
IMPORTS (SERVICES) : (US $ Billion) (PROVISIONAL) |
||
|
December 2019 |
April-December 2019-20 |
|
|
EXPORTS (Receipts) |
20.00 |
160.27 |
|
IMPORTS (Payments) |
12.56 |
98.99 |
|
Trade Balance |
7.45 |
61.28 |
|
EXPORTS
& IMPORTS (SERVICES): (Rs. Crore) (PROVISIONAL) |
||
|
December 2019 |
April-December 2019-20 |
|
|
EXPORTS (Receipts) |
1,42,413.68 |
11,28,639.25 |
|
IMPORTS (Payments) |
89,382.31 |
6,97,158.95 |
|
Trade Balance |
53,031.37 |
4,31,480.30 |
Source:
RBI Press Release dated 14thFebruary 2020
*Note: The latest data for services sector released by RBI
is for December 2019. The data for January2020 is an estimation, which will be
revised based on RBI’s subsequent release.
[Click
here for Import-Export Quick
Estimates for Selected Major Commodities for January 2020]