Exports
Contract 9.71% in June; Trade Deficit Narrows to $15.28 bn
as Imports Fall as Oil Crashes
Gold Import Up 13%
[MoC&I
Press Release dated 15 July 2019]
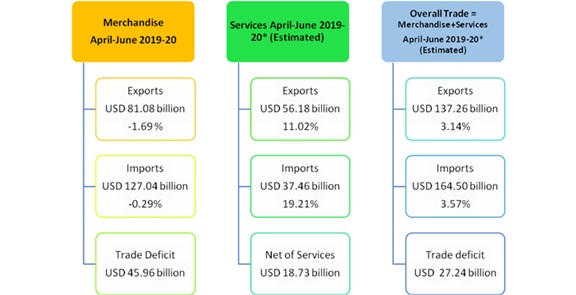
India’s overall exports (Merchandise and Services combined) in
April-June2019-20* are estimated to be USD 137.26billion, exhibiting a positive growth of 3.14per cent over the same period last year.
Overall imports in April-June 2019-20* are estimated to be USD 164.50billion, exhibiting
a positive growth of 3.57per cent over the same period
last year.
*Note: The latest data for services sector released by RBI is
for May 2019. The data for June 2019 is an estimation, which will be revised based
on RBI’s subsequent release.
I. MERCHANDISE TRADE
EXPORTS (including re-exports)
Exports in June 2019 were USD25.01billion, as compared to USD27.70billion
in June 2018, exhibiting a negative growth of 9.71per cent. In Rupee terms, exports
were Rs. 1,73,682.55crore in
June 2019, as compared to Rs. 1,87,800.20crore in June
2018, registering a negative growth of 7.52per cent.
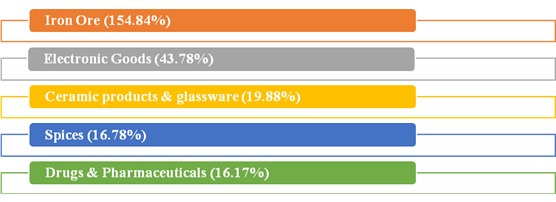
In June 2019, major commodity groups of export showing positive growth over the corresponding month of last year are
Cumulative value of exports for the period April-June 2019-20
was USD81.08billion (Rs.5,63,984.51crore) as against USD82.47billion (Rs.5,52,781.61crore)
during the period April-June 2018-19, registering a negative growth of 1.69per cent
in Dollar terms (positive growth of 2.03per cent in Rupee terms).
Non-petroleum and Non Gems and Jewellery
exports in June 2019 were USD19.15billion, as compared to USD20.13billion in June
2018, exhibiting a negative growth of 4.86per cent. Non-petroleum and Non Gems and
Jewellery exports in April-June 2019-20 were USD60.10billion,
as compared to USD59.86billion for the corresponding period in 2018-19, an increase
of 0.40per cent.
IMPORTS
Imports in June 2019 were USD40.29billion (Rs. 2,79,771.07crore), which was 9.06per cent lower in Dollar
terms and 6.85per cent lower in Rupee terms over imports of USD44.30billion (Rs.3,00,351.83crore)
in June 2018. Cumulative value of imports for the period April-June 2019-20 was
USD127.04billion (Rs.8,83,652.93crore), as against USD127.41billion (Rs.8,54,096.98crore)
during the period April-June 2018-19, registering a negative growth of 0.29per cent
in Dollar terms (positive growth of 3.46per cent in Rupee terms).
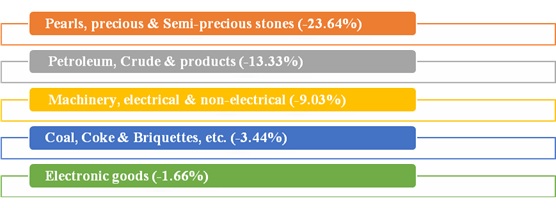
Major commodity groups of import showing negative growth in June
2019 over the corresponding month of last year are:
CRUDE OIL AND NON-OIL IMPORTS:
Oil imports inJune 2019 were USD11.03billion
(Rs. 76,586.73crore), which was 13.33 percentlower in Dollar terms (11.23percent lower in Rupee terms),
compared to USD12.73billion (Rs. 86,270.79crore) in June2018.
Oil imports in April-June 2019-20 were USD34.85billion (Rs.
2,42,398.55crore) which was 0.62per cent higher in Dollar terms (4.36percent higher
in Rupee terms) compared to USD34.64billion (Rs. 2,32,269.14crore),
over the same period last year.
In this connection it is mentioned that the global Brent price
($/bbl) has decreased by 15.81% in June 2019 vis-à-vis
June 2018 as per data available from World Bank (Pink Sheet).
Non-oil imports in June 2019 were estimated at USD29.26 billion
(Rs. 2,03,184.34crore) which
was 7.34per cent lower in Dollar terms (5.09percent lower in Rupee terms), compared
to USD31.58billion (Rs. 2,14,081.04crore) in June 2018.
Non-oil imports in April-June 2019-20 were USD92.19billion (Rs.
6,41,254.38crore) which was 0.62per cent lower in Dollar terms (3.12percent higher
in Rupee terms), compared to USD92.77 billion (Rs. 6,21,827.84crore)
in April-June2018-19.
Non-Oil and Non-Gold imports wereUSD26.57billion in June 2019,
recording a negative growth of 9.00per cent, as compared to Non-Oil and Non-Gold
imports of USD 29.19billion in June 2018. Non-Oil and Non-Gold imports wereUSD80.75billion
in April-June 2019-20, recording a negative growth of 4.25per cent, as compared
to Non-Oil and Non-Gold imports USD 84.33billion in April-June 2018-19.
II. TRADE IN SERVICES
EXPORTS (Receipts)
As per the latest press release by RBI dated 15thJuly
2019, exports in May 2019 were USD 18.68 billion (Rs.
1,30,329.17 crore) registering a positive growth of 15.49
per cent in dollar terms, vis-à-vis May 2018. The estimated value of services export
for June 2019* is USD 19.44 billion.
IMPORTS (Payments)
As per the latest press release by RBI dated 15thJuly
2019, imports in May 2019 were USD 12.49 billion (Rs.
87,160.56 crore) registering a positive growth of 22.37 per cent in dollar terms,
vis-à-vis May 2018. The estimated value of service Import for June 2019* is USD
13.56 billion.
III.TRADE BALANCE
MERCHANDISE: The trade deficit for June 2019 was estimated at USD15.28billion as against the deficit of USD16.60billion
in June 2018.
SERVICES: As per RBI’s Press Release dated 15thJuly
2019, the trade balance in Services (i.e. Net Services export) for May, 2019 is estimated at USD6.19billion.
OVERALL TRADE BALANCE: Taking merchandise and
services together, overall trade deficit for April-June 2019-20* is estimated at
USD27.24billion as compared to USD25.75 billion in April-June 2018-19.
*Note: The latest data for services sector released by RBI is
for May 2019. The data for June 2019 is an estimation, which will be revised based
on RBI’s subsequent release.
MERCHANDISE TRADE
Exports & Imports : (US $ Billion)
(Provisional)
|
|
June |
April-June |
|
Exports (including re-exports) |
|
|
|
2018-19 |
27.70 |
82.47 |
|
2019-20 |
25.01 |
81.08 |
|
%Growth 2019-20/ 2018-19 |
-9.71 |
-1.69 |
|
Imports |
|
|
|
2018-19 |
44.30 |
127.41 |
|
2019-20 |
40.29 |
127.04 |
|
%Growth 2019-20/ 2018-19 |
-9.06 |
-0.29 |
|
Trade Balance |
|
|
|
2018-19 |
-16.60 |
-44.94 |
|
2019-20 |
-15.28 |
-45.96 |
|
|
|
|
SERVICES TRADE
Exports & Imports
(Services) : (US $ Billion)
(Provisional)
|
|
May 2019 |
April-May 2019-20 |
|
EXPORTS (Receipts) |
18.68 |
36.74 |
|
IMPORTS (Payments) |
12.49 |
23.89 |
|
TRADE BALANCE |
6.19 |
12.85 |
|
|
|
|
Exports & Imports (Services): (Rs. Crore)
(Provisional)
|
|
May2019 |
April-May
2019-20 |
|
EXPORTS (Receipts) |
1,30,329.17 |
2,55,728.94 |
|
IMPORTS (Payments) |
87,160.56 |
1,66,321.68 |
|
TRADE BALANCE |
43,168.62 |
89,407.27 |
Source: RBI Press Release
dated 15th July 2019
Note: Services data pertains to May 2019 as it is the latest
data available as per RBI’s Press Release dated 15thJuly 2019. This data
is provisional and subject to revision by RBI.