Exports Crash by USD 1.5bn in Aug, Electronics and Iron Ore only Silver
Lining
·
Imports
of Cotton and Steel Shoot up as Gold Falls
[MoC&I Press Release dated 13.09.2019]
India’s overall exports (Merchandise and Services combined) in
April-August2019-20* are estimated to be USD 227.36 billion, exhibiting a positive
growth of 3.20 per cent over the same period last year. Overall imports in April-August
2019-20* are estimated to be USD 268.24billion, exhibiting a negative growth of
1.18per cent over the same period last year.

*Note: The latest data for services sector released by RBI is
for July 2019. The data for August 2019 is an estimation, which will be revised
based on RBI’s subsequent release.
I. MERCHANDISE TRADE
Exports (including re-exports)
Exports in August 2019 were USD26.13 billion,
as compared to USD27.81 billion in August 2018, exhibiting a negative growth of
6.05 per cent. In Rupee terms, exports were Rs. 1,85,881.11 crore in August 2019, as compared to Rs. 1,93,397.12 crore in August 2018, registering a negative
growth of 3.89 per cent.
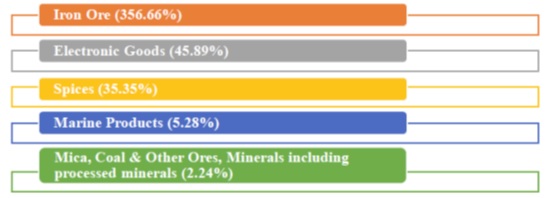
In August 2019, major commodity groups of export showing positive growth over the corresponding month of last year are
Cumulative value of exports for the period April-August 2019-20
was USD133.54 billion (Rs.9,31,055.96 crore) as against USD135.62 billion (Rs.9,20,240.02
crore) during the period April-August 2018-19, registering a negative growth of
1.53 per cent in Dollar terms (positive growth of 1.18 per cent in Rupee terms).
Non-petroleum and Non Gems and Jewellery
exports in August 2019 were USD19.60 billion, as compared
to USD20.76 billion in August 2018, exhibiting a negative growth of 5.61 per cent.
Non-petroleum and Non Gems and Jewellery exports in April-August
2019-20 were USD99.41 billion, as compared to USD99.17
billion for the corresponding period in 2018-19, an increase of 0.24 per cent.
Imports
Imports in August 2019 were USD39.58 billion (Rs. 2,81,606.41 crore), which was 13.45 per cent lower in Dollar
terms and 11.46 per cent lower in Rupee terms over imports of USD45.73 billion (Rs.3,18,043.86
crore) in August 2018. Cumulative value of imports for the period April-August 2019-20
was USD206.39 billion (Rs.14,38,839.05crore), as against
USD218.81 billion (Rs.14,85,661.27crore) during the period April-August 2018-19,
registering a negative growth of 5.68 per cent in Dollar terms (negative growth
of 3.15per cent in Rupee terms).
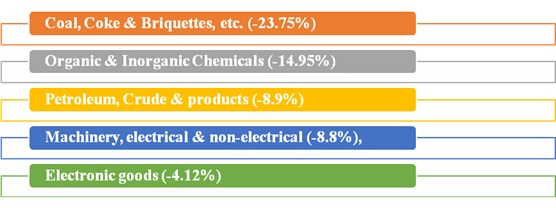
Major commodity groups of import showing negative growth in August
2019 over the corresponding month of last year are:
Crude Oil and Non-Oil Imports:
Oil imports in August 2019 were USD10.88 billion
(Rs. 77,380.49 crore), which was 8.90 percent lower in
Dollar terms (6.81percent lower in Rupee terms), compared to USD11.94 billion (Rs. 83,032.28 crore) in August2018. Oil imports in April-August
2019-20 were USD55.33 billion (Rs. 3,85,835.81 crore) which was 6.34 per cent lower in Dollar terms
(3.81 percent lower in Rupee terms) compared to USD59.07billion (Rs. 4,01,124.26 crore), over the same period last year.
In this connection it is mentioned that the global Brent price
($/bbl) has decreased by 18.98% in August 2019 vis-à-vis
August 2018 as per data available from World Bank.
Non-oil imports in August 2019 were estimated at USD28.71 billion
(Rs. 2,04,225.92 crore) which
was 15.05 per cent lower in Dollar terms (13.10 percent lower in Rupee terms), compared
to USD33.79 billion (Rs. 2,35,011.57 crore) in August
2018. Non-oil imports in April-August 2019-20 were USD151.06 billion (Rs. 10,53,003.24crore) which was 5.43
per cent lower in Dollar terms (2.91 percent lower in Rupee terms), compared to
USD159.74 billion (Rs. 10,84,537.01crore) in April-August2018-19.
Non-Oil and Non-Gold imports wereUSD27.34 billion in August 2019,
recording a negative growth of 9.33 per cent, as compared to Non-Oil and Non-Gold
imports of USD 30.15 billion in August 2018. Non-Oil and Non-Gold imports wereUSD136.53
billion in April-August 2019-20, recording a negative growth of 5.64 per cent, as
compared to Non-Oil and Non-Gold imports USD 144.69 billion in April-August 2018-19.
II. TRADE IN SERVICES
Exports (Receipts)
As per the latest press release by RBI dated 13thSeptember
2019, exports in July2019 were USD 19.08 billion (Rs.
1,31,313.76 crore) registering a positive growth of 8.72
per cent in dollar terms, vis-à-vis July 2018. The estimated value of services export
for August 2019* is USD 19.44 billion.
Imports (Payments)
As per the latest press release by RBI dated 13thSeptember
2019, imports in July 2019 were USD 12.83 billion (Rs.
88,274.17 crore) registering a positive growth of 18.24 per cent in dollar terms,
vis-à-vis July 2018. The estimated value of service Import for August 2019* is USD
13.38billion.
III.TRADE BALANCE
Merchandise: The trade deficit for August 2019 was
estimated at USD13.45 billion as against the deficit of
USD17.92 billion inAugust 2018.
Services: As per RBI’s Press Release dated 13thSeptember
2019, the trade balance in Services (i.e. Net Services export) for July, 2019 is estimated at USD6.26 billion.
Overall Trade Balance: Taking merchandise and
services together, overall trade deficit for April-August 2019-20* is estimated
at USD40.89billion as compared to USD51.13billion in April-August 2018-19.
*Note: The latest data for services sector released by RBI is
for July 2019. The data for August 2019 is an estimation, which will be revised
based on RBI’s subsequent release.
MERCHANDISE
TRADE
Exports & Imports: (US $ Billion)
|
(Provisional) |
||
|
|
August |
April-August |
|
Exports(including
re-exports) |
|
|
|
2018-19 |
27.81 |
135.62 |
|
2019-20 |
26.13 |
133.54 |
|
%Growth
2019-20/ 2018-19 |
-6.05 |
-1.53 |
|
Imports |
|
|
|
2018-19 |
45.73 |
218.81 |
|
2019-20 |
39.58 |
206.39 |
|
%Growth
2019-20/ 2018-19 |
-13.45 |
-5.68 |
|
Trade
Balance |
|
|
|
2018-19 |
-17.92 |
-83.19 |
|
2019-20 |
-13.45 |
-72.85 |
Services
Trade
Exports & Imports (Services): (US $
Billion)
|
(Provisional) |
||
|
|
July
2019 |
April-July
2019-20 |
|
Exports (Receipts) |
19.08 |
74.38 |
|
Imports (Payments) |
12.83 |
48.48 |
|
Trade Balance |
6.26 |
25.90 |
|
|
|
|
EXPORTS
& IMPORTS (SERVICES): (Rs. Crore)
|
(Provisional) |
||
|
|
July
2019 |
April-July
2019-20 |
|
Exports (Receipts) |
1,31,313.76 |
5,15,865.75 |
|
Imports (Payments) |
88,274.17 |
3,36,242.10 |
|
Trade Balance |
43,039.59 |
1,79,623.65 |
Source:
RBI Press Release dated 13thSeptember 2019
Note: Services data pertains to July 2019 as it is the latest
data available as per RBI’s Press Release dated 13thSeptember 2019. This
data is provisional and subject to revision by RBI.