GST Receipts Stage at Rs 1.49 lakh Crs in Dec
·
Rs 1,49,507 crore GST Revenue collected
for December 2022, records increase of 15% Year-on-Year
·
Monthly GST revenues more than Rs 1.4
lakh crore for 10 straight months in a row
The gross GST revenue collected during
December 2022 is Rs 1,49,507 crore, of which CGST is Rs 26,711 crore,
SGST is Rs 33,357 crore, IGST is Rs 78,434 crore (including Rs 40,263
crore collected on import of goods) and Cess is Rs 11,005 crore (including
Rs 850 crore collected on import of goods).
The Government has settled Rs 36,669 crore
to CGST and Rs 31,094 crore to SGST from IGST as regular settlement. The total revenue
of Centre and the States after regular settlements in the month of December 2022
is Rs 63,380 crore for CGST and Rs 64,451 crore for the SGST.
The revenues for the month of December
2022 are 15% higher than the GST revenues in the same month last year. During
the month, revenues from import of goods was 8% higher and the revenues from
domestic transaction (including import of services) are 18% higher than the
revenues from these sources during the same month last year. During the month of
November, 2022, 7.9 crore e-way bills were generated, which was significantly higher
than 7.6 crore e-way bills generated in October, 2022.
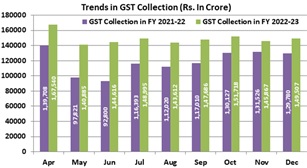
The chart below shows trends in monthly
gross GST revenues during the current year. The
table shows the state-wise figures of GST collected in each State during the month
of December, 2022 as compared to December, 2021.
|
State-wise growth of GST Revenues (Rs crore) during December 2022[1] |
||||
|
|
State |
Dec-21 |
Dec-22 |
Growth |
|
1 |
Jammu and Kashmir |
320 |
410 |
28% |
|
2 |
Himachal Pradesh |
662 |
708 |
7% |
|
3 |
Punjab |
1,573 |
1,734 |
10% |
|
4 |
Chandigarh |
164 |
218 |
33% |
|
5 |
Uttarakhand |
1,077 |
1,253 |
16% |
|
6 |
Haryana |
5,873 |
6,678 |
14% |
|
7 |
Delhi |
3,754 |
4,401 |
17% |
|
8 |
Rajasthan |
3,058 |
3,789 |
24% |
|
9 |
Uttar Pradesh |
6,029 |
7,178 |
19% |
|
10 |
Bihar |
963 |
1,309 |
36% |
|
11 |
Sikkim |
249 |
290 |
17% |
|
12 |
Arunachal Pradesh |
53 |
67 |
27% |
|
13 |
Nagaland |
34 |
44 |
30% |
|
14 |
Manipur |
48 |
46 |
-5% |
|
15 |
Mizoram |
20 |
23 |
16% |
|
16 |
Tripura |
68 |
78 |
15% |
|
17 |
Meghalaya |
149 |
171 |
15% |
|
18 |
Assam |
1,015 |
1,150 |
13% |
|
19 |
West Bengal |
3,707 |
4,583 |
24% |
|
20 |
Jharkhand |
2,206 |
2,536 |
15% |
|
21 |
Odisha |
4,080 |
3,854 |
-6% |
|
22 |
Chhattisgarh |
2,582 |
2,585 |
0% |
|
23 |
Madhya Pradesh |
2,533 |
3,079 |
22% |
|
24 |
Gujarat |
7,336 |
9,238 |
26% |
|
25 |
Daman and Diu |
2 |
- |
-86% |
|
26 |
Dadra and Nagar Haveli |
232 |
317 |
37% |
|
27 |
Maharashtra |
19,592 |
23,598 |
20% |
|
29 |
Karnataka |
8,335 |
10,061 |
21% |
|
30 |
Goa |
592 |
460 |
-22% |
|
31 |
Lakshadweep |
1 |
1 |
-36% |
|
32 |
Kerala |
1,895 |
2,185 |
15% |
|
33 |
Tamil Nadu |
6,635 |
8,324 |
25% |
|
34 |
Puducherry |
147 |
192 |
30% |
|
35 |
Andaman and Nicobar Islands |
26 |
21 |
-19% |
|
36 |
Telangana |
3,760 |
4,178 |
11% |
|
37 |
Andhra Pradesh |
2,532 |
3,182 |
26% |
|
38 |
Ladakh |
15 |
26 |
68% |
|
97 |
Other Territory |
140 |
249 |
78% |
|
99 |
Center Jurisdiction |
186 |
179 |
-4% |
|
|
Grand Total |
91,639 |
1,08,394 |
18% |