India One of
the Worst Performer Among Global Exporters
· India
Exports Crash from $30bn per month to $20bn in Last Four Years as Economy Loses
Competitiveness
· WTO
Forecasts World Trade Growth to Fall by 1.1% to jest 1.7% in 2016
· 2017
may be a Repeat of 2016
· Contraction
driven by slowing GDP and trade growth in China and Brazil
· North
America, which had the strongest import growth of any region in 2014-15 too has
decelerated
World
trade will grow more slowly than expected in 2016, expanding by just 1.7%, well
below the April forecast of 2.8%, according to the latest WTO estimates. The
forecast for 2017 has also been revised, with trade now expected to grow
between 1.8% and 3.1%, down from 3.6% previously. With expected global GDP growth
of 2.2% in 2016, this year would mark the slowest pace of trade and output
growth since the financial crisis of 2009.
Main
Points
World
merchandise trade volume is expected to grow 1.7% in 2016, accompanied by real
GDP growth of 2.2% at market exchange rates. This would be the slowest pace of
trade and output growth since the financial crisis of 2009.
Trade
growth was weaker than expected in the first half of 2016 due to falling import
demand and slowing GDP growth in several major developing economies as well as
in North America.
Trade
in 2017 is expected to grow between 1.8% and 3.1%, a range being provided to
reflect potential changes in the relationship between trade and output.
Certain
trade-related indicators have improved, including export orders and container
port throughput, but overall momentum in trade remains weak.
The downgrade follows a sharper than expected decline
in merchandise trade volumes in the first quarter (-1.1% quarter-on-quarter, as
measured by the average of seasonally-adjusted exports and imports) and a
smaller than anticipated rebound in the second quarter (+0.3%).
The latest figures are a disappointing development and
underline a recent weakening in the relationship between trade and GDP growth.
Over the long term trade has typically grown at 1.5 times faster than GDP,
though in the 1990s world merchandise trade volume grew about twice as fast as
world real GDP at market exchange rates. In recent years however, the ratio has
slipped towards 1:1, below both the peak of the 1990’s and the long-term
average.
Falling
Commodity Prices
The
stagnation of world merchandise trade disguises strong shifts at the regional
level. There is the steep decline in imports of resource-exporting regions over
the last two years, driven by falling commodity prices and declining export
revenues.
Some
Hope
There
are some indications that trade may be picking up in the second half of 2016,
although the pace of expansion is likely to remain subdued. Container port
throughput has increased, export orders have risen in the United States, and
nominal trade flows in US dollar terms have stabilized, but numerous risks
remain.
The potential effects of the Brexit
vote in the United Kingdom has increased uncertainty about future trading
arrangements in Europe, a region where trade growth has been relatively strong.
Pound
Falls
The
UK referendum result did not produce an immediately observable downturn in
economic activity as measured by industrial production or employment; the main impact
was a 13% drop in the exchange rate of the pound against the US dollar and an
11% decline in its value against the euro. Effects over the longer term remain
to be seen. Economic forecasts for the UK in 2017 range from fairly optimistic
to quite pessimistic. Our forecast assumes an intermediate case, with a growth
slowdown next year but not an outright recession.
Exports of developed countries are expected to outpace
those of developing economies this year, 2.1% compared to 1.2%. On the import
side, developing countries are expected to register sluggish growth of 0.4%
compared to 2.6% for developed countries.
Imports
Crash in Latin America but Exports Pick Up
The biggest downward revision to imports from our April
forecast for 2016 applies to South America (-8.3% compared to -4.5% previously)
as the recession in Brazil intensified. This was followed by North America,
where import growth was revised down from 4.1% to 1.9% as GDP growth came in
below earlier projections. Asian import growth was also scaled back to 1.6%
from 3.2%, while our forecast for Europe was revised upward from 3.2% to 3.7%.
Export growth in 2016 was downgraded for most regions,
with the strongest revisions applied to Asia (0.3% compared to 3.4% in April)
and North America (0.7% compared to 3.1%). Meanwhile, South America’s export
growth is expected to be stronger than previously forecast (4.4% compared
1.9%), benefitting from favourable exchange rate
movements. Even with the downward revision to our estimates, risks to the
forecast remain mostly on the downside.
Contradiction
of Global Supply Chains, E-Commerce
A
number of reasons have been advanced to explain the decline in the ratio of
trade growth to GDP growth in recent years, including the changes in the import
content of demand, absence of trade liberalization, creeping protectionism, a
contraction of global value chains (GVCs), and possibly the increasing role of
the digital economy and e-commerce, but all have likely played a role. Whatever
the cause, the recent run of weak trade, and economic, growth suggests the need
for a better understanding of changing global economic relationships.
It
should be noted that the trade forecasts relate to changes in the quantity of
goods traded rather than changes in their dollar value. In 2015, merchandise
trade volumes continued to grow slowly despite the sharp 14% decline in the
dollar value of world trade, which was largely due to the appreciation of the
US dollar.
Volumes have grown but value
has fallen with dollar depreciation
Annual % change
|
|
2012 |
2013 |
2014 |
2015 |
2016P |
2017P |
|
|
Volume of world merchandise trade |
2.2 |
2.4 |
2.8 |
2.7 |
1.7 |
1.8 |
3.1 |
|
Exports |
|
|
|
|
|
|
|
|
North America |
4.5 |
2.8 |
4.1 |
0.8 |
0.7 |
1.6 |
2.9 |
|
South and Central America |
0.9 |
1.2 |
‐1.8 |
1.3 |
4.4 |
3.1 |
5.5 |
|
Europe |
0.8 |
1.7 |
2.0 |
3.7 |
2.8 |
1.8 |
3.1 |
|
Asia |
2.7 |
5.0 |
4.8 |
3.1 |
0.3 |
1.8 |
3.2 |
|
Other regions
a |
3.9 |
0.6 |
‐0.1 |
3.9 |
2.5 |
1.5 |
2.6 |
|
Imports |
|
|
|
|
|
|
|
|
North America |
3.2 |
1.2 |
4.7 |
6.5 |
1.9 |
1.9 |
3.1 |
|
South and Central America |
0.7 |
3.6 |
‐2.2 |
‐5.8 |
‐8.3 |
2.2 |
3.7 |
|
Europe |
‐1.8 |
‐0.3 |
3.2 |
4.3 |
3.7 |
1.8 |
3.1 |
|
Asia |
3.7 |
4.8 |
3.3 |
1.8 |
1.6 |
2.0 |
3.3 |
|
Other regions
a |
9.9 |
3.5 |
‐0.5 |
‐6.0 |
‐2.8 |
0.6 |
1.0 |
a Other regions comprise the Africa, Commonwealth of Independent States and Middle East.
Sources: WTO Secretariat for trade, concensus
estimates for GDP.
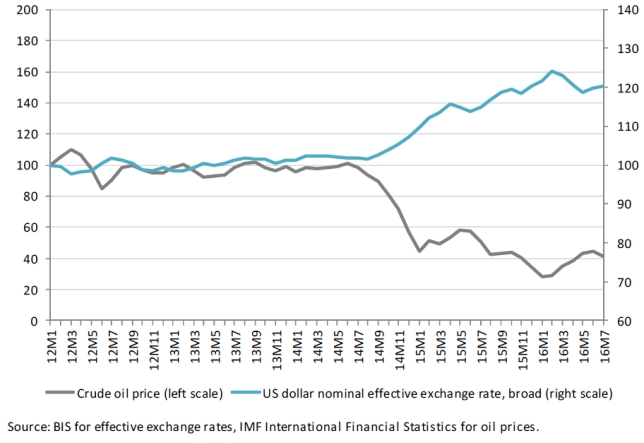
Dollar
Depreciates in 2016
As
chart below shows, the dollar has started to depreciate again in the first half
of 2016, with an inverse effect on values of traded goods, particularly
commodities such as oil. If this trend continues for the remainder of the year,
world merchandise trade growth in dollar terms could exceed trade growth in
volume terms in 2016. Trade developments in current dollar terms are shown for
selected economies.
Effective exchange rates
and crude oil prices, Jan. 2012 - Jul. 2016
(Indices, January
2012=100)
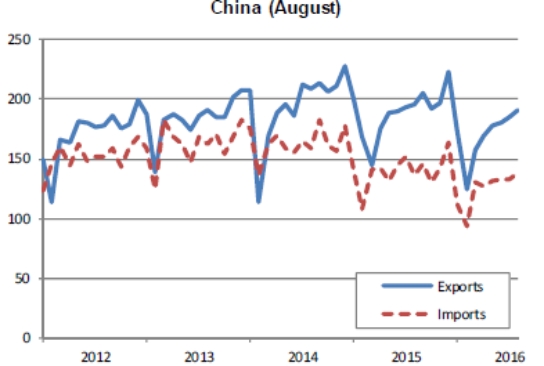
Merchandise exports and imports of selected
economies, January 2012-July 2016
(Billion dollars)