Rs. 86,449 crore of Gross GST Revenue Collected in the Month of August
·
States
Show Significant Shortfalls, IGST Satisfactory
[MoF
Press Release/01.09.2020]
The gross GST revenue collected in the month of August, 2020
is Rs. 86,449 crore of which CGST is Rs. 15,906 crore, SGST is Rs. 21,064
crore, IGST is Rs. 42,264 crore (including Rs. 19,179 crore collected on import of goods) and Cess is Rs.7,215 crore (including Rs.
673 crore collected on import of goods).
The government has settled Rs. 18,216
crore to CGST and Rs. 14,650 crore to SGST from IGST as
regular settlement. The total revenue earned by Central Government and the State
Governments after regular settlement in the month of August, 2020 is Rs. 34,122 crore for CGST and Rs.
35,714 crore for the SGST.
The revenues for the month are 88% of the GST revenues in the
same month last year. During the month, the revenues from import of goods were 77%
and the revenues from domestic transaction (including import of services) were 92%
of the revenues from these sources during the same month last year. It may also
be noted that the taxpayers with turnover less than Rs.
5 crore continue to enjoy relaxation in filing of returns till September.
The chart shows trends in monthly gross GST revenues during the
current year. The table shows the state-wise figures of GST collected in each State
during the month of August 2020 as compared to August 2019 and for the full year
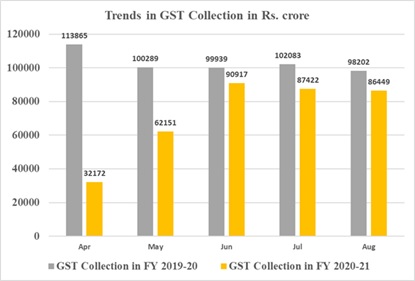
Table:
State-wise collection till August[1]
|
|
|
Aug-19 |
Aug-20 |
Growth |
|
1 |
Jammu and Kashmir |
302 |
326 |
8% |
|
2 |
Himachal Pradesh |
676 |
597 |
-12% |
|
3 |
Punjab |
1,255 |
1,139 |
-9% |
|
4 |
Chandigarh |
160 |
139 |
-13% |
|
5 |
Uttarakhand |
941 |
1,006 |
7% |
|
6 |
Haryana |
4,474 |
4,373 |
-2% |
|
7 |
Delhi |
3,517 |
2,880 |
-18% |
|
8 |
Rajasthan |
2,550 |
2,582 |
1% |
|
9 |
Uttar Pradesh |
4,975 |
5,098 |
2% |
|
10 |
Bihar |
981 |
967 |
-1% |
|
11 |
Sikkim |
163 |
147 |
-10% |
|
12 |
Arunachal Pradesh |
45 |
35 |
-22% |
|
13 |
Nagaland |
27 |
31 |
17% |
|
14 |
Manipur |
37 |
26 |
-29% |
|
15 |
Mizoram |
28 |
12 |
-56% |
|
16 |
Tripura |
58 |
43 |
-26% |
|
17 |
Meghalaya |
117 |
108 |
-7% |
|
18 |
Assam |
768 |
709 |
-8% |
|
19 |
West Bengal |
3,503 |
3,053 |
-13% |
|
20 |
Jharkhand |
1,770 |
1,498 |
-15% |
|
21 |
Odisha |
2,497 |
2,348 |
-6% |
|
22 |
Chattisgarh |
1,873 |
1,994 |
6% |
|
23 |
Madhya Pradesh |
2,255 |
2,209 |
-2% |
|
24 |
Gujarat |
6,185 |
6,030 |
-3% |
|
25 |
Daman and Diu |
103 |
70 |
-32% |
|
26 |
Dadra and Nagar
Haveli |
159 |
145 |
-9% |
|
27 |
Maharashtra |
13,407 |
11,602 |
-13% |
|
29 |
Karnataka |
6,201 |
5,502 |
-11% |
|
30 |
Goa |
325 |
213 |
-34% |
|
31 |
Lakshadweep |
1 |
0 |
-72% |
|
32 |
Kerala |
1,582 |
1,229 |
-22% |
|
33 |
Tamil Nadu |
5,973 |
5,243 |
-12% |
|
34 |
Puducherry |
161 |
137 |
-15% |
|
35 |
Andaman and Nicobar
Islands |
30 |
13 |
-59% |
|
36 |
Telangana |
3,059 |
2,793 |
-9% |
|
37 |
Andhra Pradesh |
2,115 |
1,955 |
-8% |
|
38 |
Ladakh |
0 |
5 |
|
|
97 |
Other Territory |
170 |
180 |
6% |
|
99 |
Centre Jurisdiction |
100 |
161 |
61% |
[1] Does not include GST on
import of goods