Shrimp Exports to ASEAN in 13-14 Up 84% on Rising Prices in 13-14
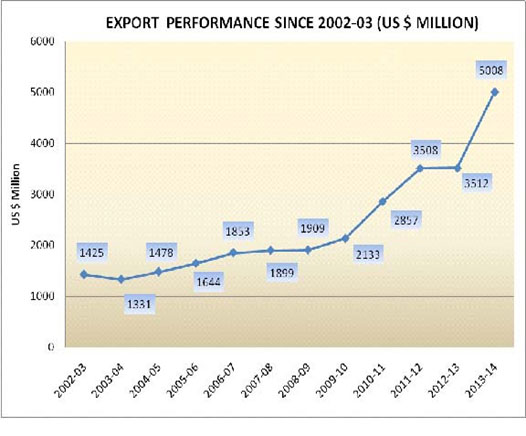
During the financial year 2013-14, exports of marine
products reached an all-time high of US$ 5007.70 million. Marine product exports
crossed all previous records in quantity, rupee value and US$ terms. Exports
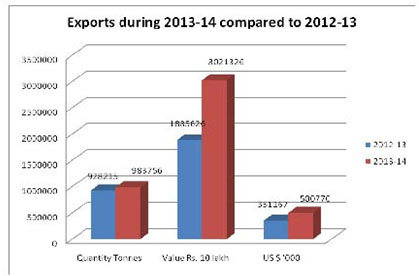
aggregated to 9,83,756 MT valued at Rs. 30,213.26 crores and US$
5,007.70 million. Compared to the previous year, seafood exports recorded a
growth of 5.98 % in quantity, 60.23% in rupee and 42.6 % growth in US$ earnings
respectively. The unit value realization also reached to record high from
USD/Kg 3.78 during 2012-13 to USD/Kg 5.09 during 2013-14 and recorded growth of
34.55%. The increased production of L. Vannamei shrimp
has helped to achieve higher exports.
Exports during 2013-14 compared to 2012-13
|
Export details |
2012-13 |
2013-14 |
Growth %
|
|
Quantity Tonnes |
928215 |
983756 |
5.98 |
|
Value Rs.crore |
18856.26 |
30213.26 |
60.23 |
|
Value US $ Million |
3511.67 |
5007.70 |
42.60 |
|
Unit value (US$/Kg) |
3.78 |
5.09 |
34.55 |
Major items of export
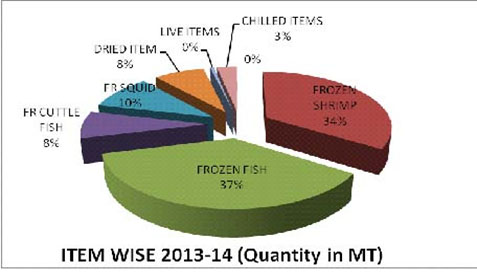
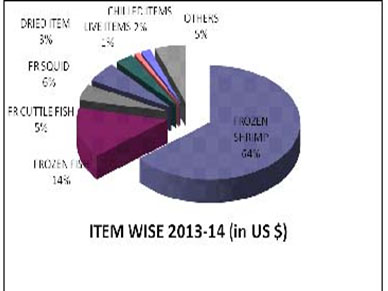
Frozen shrimp continued to be the major export value
item accounting for a share of 64.12% of the total US$ earnings. Shrimp exports
during the period increased by 31.85%, 99.54% and 78.06% in quantity, rupee
value and US$ value respectively. There was all time high growth in unit
value realization of frozen shrimp at 35.05%.
The overall export of shrimp during 2013-14 was to the
tune of 3,01,435 MT worth US$ 3210.94 million. USA is
the largest market (95,927MT) for frozen shrimps exports in quantity terms
followed by European Union (73,487 MT), South East Asia (52,533MT) and Japan
(28,719 MT).
The contribution of cultured shrimp to the total
shrimp export is 73.31% in terms of US$. The export of cultured shrimp has
shown tremendous growth of 36.71% in quantity and 92.29% in dollar terms.
The export of Vannamei has
shown tremendous growth to 1,75,071 MT from 91,171 MT
and US$ 1,994.27 million from 731.01 million compared to 2012-13. The export of
Vannamei recorded a growth of 92.03% in quantity and
172.81% in dollar terms. 44.59 % of total Vannamei
shrimp was exported to USA followed by 17.07% to EU, 16.54%
to South East Asian countries and 4.01 % to Japan in terms US$. Export of Black
Tiger shrimp reduced from US $521.33 million to 435.79 million and 61,177 MT to
34,133 MT compared to last year.
Fish, has retained its position as the principal
export item in quantity terms and the second largest export item in value
terms, accounting for a share of about 32.97% in quantity and 14.15% in US$
earnings. Unit value realization of fish also increased by
21.65%.
Export of Fr. Squid has shown growth of 15.98%, 25.68%
and 10.78% in terms of Quantity, Rupee Value in and US$ terms. However it has
shown decrease in unit value realization by 4.48%. Fr. Cuttlefish recorded a
growth of 8.34% in quantity. Dried items have shown a positive growth in
terms of rupee value by 21.72% and in dollar terms by 9.86%. Live items exports
shown a growth by 16.17%, 42.43% and 26.81% in quantity, rupee value and US $
realization respectively compared to the previous year.
The details of major items of exports are given in the
following table
|
Item wise Exports April-
2013 to March- 2014 |
|||||
|
Q: Quantity in Tons |
|
V: Value in Rs. Crores |
|
$: USD Million |
|
|
Item |
|
Share % |
Apr 2013-Mar 2014 |
Apr 2013-Mar 2014 |
(%) change |
|
Frozen Shrimp |
Q: |
31 |
301435 |
228620 |
31.85 |
|
|
V: |
64.11 |
19368.30 |
9706.36 |
99.54 |
|
|
$: |
64.12 |
3210.94 |
1803.26 |
78.06 |
|
|
UV$: |
|
10.65 |
7.89 |
35.05 |
|
Frozen Fish |
Q: |
33 |
324359 |
343876 |
-5.68 |
|
|
V: |
14.22 |
4294.81 |
3296.86 |
30.27 |
|
|
$: |
14.15 |
708.63 |
617.59 |
14.74 |
|
|
UV$: |
|
2.18 |
1.80 |
21.65 |
|
FR Cuttle
Fish |
Q: |
7 |
68577 |
63296 |
8.34 |
|
|
V: |
4.59 |
1386.98 |
1354.28 |
2.41 |
|
|
$: |
4.56 |
228.13 |
251.54 |
-9.31 |
|
|
UV$: |
|
3.33 |
3.97 |
-16.29 |
|
FR SQUID |
Q: |
9 |
87437 |
75387 |
15.98 |
|
|
V: |
5.73 |
1731.97 |
1378.08 |
25.68 |
|
|
$: |
5.68 |
284.60 |
256.90 |
10.78 |
|
|
UV$: |
|
3.25 |
3.41 |
-4.48 |
|
DRIED ITEM |
Q: |
7 |
67901 |
72953 |
-6.93 |
|
|
V: |
3.30 |
998.00 |
819.90 |
21.72 |
|
|
$: |
3.35 |
167.89 |
152.81 |
9.86 |
|
|
UV$: |
|
2.47 |
2.09 |
18.04 |
|
LIVE ITEMS |
Q: |
1 |
5080 |
4373 |
16.17 |
|
|
V: |
0.93 |
281.85 |
197.89 |
42.43 |
|
|
$: |
0.93 |
46.70 |
36.82 |
26.81 |
|
|
UV$: |
|
9.19 |
8.42 |
9.16 |
|
CHILLED ITEMS |
Q: |
2 |
19755 |
26868 |
-26.47 |
|
|
V: |
1.75 |
527.84 |
537.11 |
-1.73 |
|
|
$: |
1.77 |
88.48 |
99.87 |
-11.41 |
|
|
UV$: |
|
4.48 |
3.72 |
20.49 |
|
OTHERS |
Q: |
11 |
109212 |
112841 |
-3.22 |
|
|
V: |
5.37 |
1623.50 |
1565.78 |
3.69 |
|
|
$: |
5.44 |
272.34 |
292.86 |
-7.01 |
|
|
UV$: |
|
2.49 |
2.60 |
-3.92 |
|
TOTAL |
Q: |
100 |
983756 |
928215 |
5.98 |
|
|
V: |
100 |
30213.26 |
18856.26 |
60.23 |
|
|
$: |
100 |
5007.70 |
3511.67 |
42.60 |
|
|
UV$: |
|
5.09 |
3.78 |
34.55 |
Major export markets
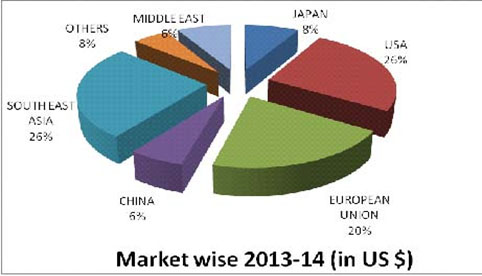
South East Asia continued to be the largest buyer of Indian marine
products with a share of 26.38% in terms of US $ value realization. USA
is the second largest market with a share of 25.68% followed by European Union
(EU) (20.24%), Japan (8.21%), other countries (8.20%), China (5.85%) and Middle
East (5.45%).
The exports to South East Asian Countries as shown positive growth
by 11.47%, 84.67% and 62.72% in terms of Quantity, Rupee value and US dollar
terms respectively.
Exports to US had registered a tremendous growth of 19.94% in quantity and 72.06% in US$ realization and is
mainly attributed to the export of Fr. Shrimp which showed a growth of about 34.81% in volume and 92.40% in US$ terms. Exports of Vannamei shrimp showed a tremendous increase in US market
by 59.63 % in quantity and 135.71%
in US$ realization.
Export to Japan registered increase
in terms of US$ by 10.30%. Export
of Frozen Shrimp increased by 7.38% in quantity terms and 28.23 % in dollar
terms.
Export to Middle East countries has shown good growth of 40.13%,
43.65% and 30.29% in terms of Quantity, Value and Dollar terms respectively.
The details on major markets for Indian marine products are given
in the following table.
|
Market wise Exports - April-
2013 to March- 2014 |
|||||
|
Q: Quantity in Tons |
V: Value in Rs. Crores |
|
$: USD Million |
|
|
|
Country |
|
Share % |
Apr 2013-Mar 2014 |
Apr 2012- Mar 2013 |
(%) |
|
JAPAN |
Q: |
7.27 |
71484 |
76648 |
-6.74 |
|
V: |
8.16 |
2463.83 |
1999.59 |
23.22 |
|
|
$: |
8.21 |
410.95 |
372.57 |
10.30 |
|
|
USA |
Q: |
11.27 |
110880 |
92447 |
19.94 |
|
V: |
25.63 |
7744.67 |
4026.48 |
92.34 |
|
|
$: |
25.68 |
1286.04 |
747.45 |
72.06 |
|
|
EUROPEAN UNION |
Q: |
17.76 |
174686 |
158357 |
10.31 |
|
V: |
20.29 |
6129.69 |
4176.42 |
46.77 |
|
|
$: |
20.24 |
1013.28 |
777.41 |
30.34 |
|
|
CHINA |
Q: |
7.70 |
75783 |
87776 |
-13.66 |
|
V: |
5.85 |
1766.72 |
1444.86 |
22.28 |
|
|
$: |
5.85 |
293.12 |
269.47 |
8.78 |
|
|
SOUTH EAST ASIA |
Q: |
38.63 |
380061 |
340944 |
11.47 |
|
V: |
26.63 |
8046.59 |
4357.28 |
84.67 |
|
|
$: |
26.38 |
1320.95 |
811.80 |
62.72 |
|
|
MIDDLE EAST |
Q: |
5.90 |
58040 |
41419 |
40.13 |
|
V: |
5.29 |
1599.37 |
1113.34 |
43.65 |
|
|
$: |
5.45 |
272.65 |
209.26 |
30.29 |
|
|
OTHERS |
Q: |
11.47 |
112822 |
130623 |
-13.63 |
|
V: |
8.15 |
2462.40 |
1738.29 |
41.66 |
|
|
$: |
8.20 |
410.71 |
323.71 |
26.88 |
|
|
Total |
Q: |
100 |
983756 |
928215 |
5.98 |
|
V: |
100 |
30213.26 |
18856.26 |
60.23 |
|
|
$: |
100 |
5007.70 |
3511.67 |
42.60 |
|
Major Port wise Exports:
Marine products were exported through 26 sea/air/land ports.
Exports improved from Vizag, Chennai, Krishnapatnam, Tuticorin and Mangalore
compared to the corresponding period during the last year. Pipavav
is the major port in terms of quantity (25.27%) and Vizag
is the major port in terms of dollar value (22.59%).
Outlook for 2014-15
MPEDA envisages target of USD 6.0 Billion for the year 2014-15.
Increased production of L. Vannamei shrimp, Quality
control measures and increase in infrastructure facilities for production of
value added items are expected to help in achieving this target.
[Source: PIB (MoC&I)
Press Release dated 30th May 2014]