Textiles Crash in July, Engg, Diamonds
Follow
· Oil Up as Global Price Rebound
·
Raw
Materials, Crude, Silver Cotton Imports Peak
INDIA’S
FOREIGN TRADE: July 2022
<Quick Estimates
for Selected Major Commodities for July 2022>
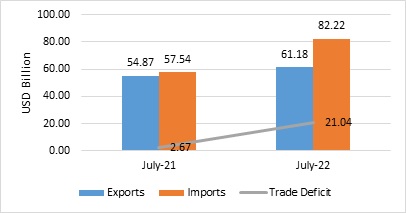
India’s overall exports (Merchandise and Services combined)
in July 2022* are estimated to be USD 61.18 Billion, exhibiting a positive growth of 11.51 per cent over the same period last
year. Overall imports in July 2022* are estimated to be USD 82.22 Billion,
exhibiting a positive growth of 42.90 per cent over
the same period last year.
Table 1: Trade during July 2022*
|
|
|
July
2022 (USD
Billion) |
July
2021 (USD
Billion) |
Growth
vis-à-vis July 2021 (%) |
|
Merchandise |
Exports |
36.27 |
35.51 |
2.14 |
|
Imports |
66.27 |
46.15 |
43.61 |
|
|
Trade
Balance |
-30.00 |
-10.63 |
-182.10 |
|
|
Services* |
Exports |
24.91 |
19.36 |
28.69 |
|
Imports |
15.95 |
11.39 |
40.02 |
|
|
Net
of Services |
8.96 |
7.97 |
12.49 |
|
|
Overall
Trade (Merchandise+ Services)
* |
Exports |
61.18 |
54.87 |
11.51 |
|
Imports |
82.22 |
57.54 |
42.90 |
|
|
Trade
Balance |
-21.04 |
-2.67 |
-688.49 |
* Note: The latest data for services sector released by RBI
is for June 2022. The data for July 2022 is an estimation, which will be revised
based on RBI’s subsequent release. (ii) Data for April-July 2021 has been revised on pro-rata basis using quarterly balance
of payments data.
Fig 1: Overall Trade during July 2022*
India’s overall exports (Merchandise and Services combined)
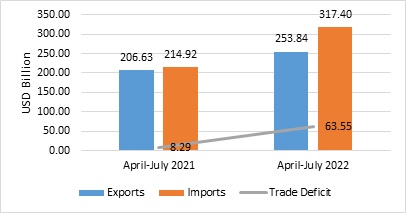
in April-July 2022* are estimated to be USD 253.84 Billion, exhibiting a positive growth of 22.85 per cent over the same period last year.
Overall imports in April-July 2022* are estimated to be USD 317.40 Billion,
exhibiting a positive growth of 47.68 per cent over
the same period last year.
Table 2: Trade during April-July 2022*
|
|
|
April-July 2022 (USD Billion) |
April-July 2021 (USD Billion) |
Growth vis-à-vis April-July 2021 (%) |
|
Merchandise |
Exports |
157.44 |
131.06 |
20.13 |
|
Imports |
256.43 |
173.12 |
48.12 |
|
|
Trade
Balance |
-98.99 |
-42.07 |
-135.31 |
|
|
Services* |
Exports |
96.40 |
75.57 |
27.56 |
|
Imports |
60.96 |
41.80 |
45.85 |
|
|
Net
of Services |
35.44 |
33.77 |
4.93 |
|
|
Overall
Trade (Merchandise+ Services)
* |
Exports |
253.84 |
206.63 |
22.85 |
|
Imports |
317.40 |
214.92 |
47.68 |
|
|
Trade
Balance |
-63.55 |
-8.29 |
-666.23 |
* Note: The latest data for services sector released by RBI is
for June 2022. The data for July 2022 is an estimation, which will be revised
based on RBI’s subsequent release. (ii) Data for April-July 2021 has been revised on pro-rata basis using quarterly balance
of payments data.
Fig 2: Overall Trade during April-July 2022*
MERCHANDISE TRADE
·
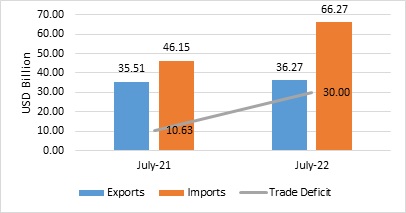
Merchandise exports in July 2022 were
USD 36.27 Billion, as compared to USD 35.51 Billion in July 2021, exhibiting a positive growth of 2.14 per cent.
·
Merchandise imports in July 2022 were
USD 66.27 Billion, which is an increase of 43.61 per cent over imports of USD
46.15 Billion in July 2021.
·
The merchandise trade deficit in July
2022 was estimated at USD 30 Billion as against USD
10.63 Billion in July 2021, which is an increase of 182.10 per cent.
Fig 3: Merchandise Trade during July 2022
·
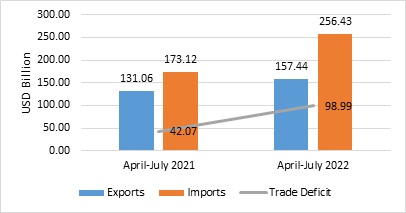
Merchandise exports for the period
April-July 2022 were USD 157.44 Billion as against USD 131.06 Billion during
the period April-July 2021, registering a positive growth
of 20.13 per cent.
·
Merchandise imports for the period
April-July 2022 were USD 256.43 Billion as against USD
173.12 Billion during the period April-July 2021, registering a positive growth
of 48.12 per cent.
·
The merchandise trade deficit for
April-July 2022 was estimated at USD 98.99 Billion as
against USD 42.07 Billion in April-July 2021, which is an increase of 135.31
per cent.
Fig 4: Merchandise Trade during April-July 2022
·
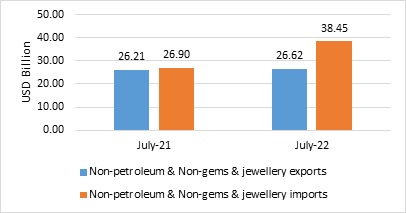
Non-petroleum and non-gems & jewellery exports in July 2022 were USD 26.62 Billion,
registering a positive growth of 1.55 per cent over non-petroleum
and non-gems & jewellery exports of USD 26.21
Billion in July 2021.
·
Non-petroleum, non-gems & jewellery (gold, silver & precious metals) imports were
USD 38.45 Billion in July 2022 with a positive growth
of 42.91 per cent over Non-petroleum, non-gems & jewellery
imports of USD 26.90 Billion in July 2021.
Table 3: Trade excluding Petroleum and Gems & Jewellery during July 2022
|
|
July
2022 (USD
Billion) |
July
2021 (USD
Billion) |
Growth
vis-à-vis July 2021 (%) |
|
Non-
petroleum exports |
29.90 |
29.67 |
0.76 |
|
Non-
petroleum imports |
45.14 |
33.74 |
33.77 |
|
Non-petroleum
& Non Gems & Jewellery exports |
26.62 |
26.21 |
1.55 |
|
Non-petroleum
& Non Gems & Jewellery imports |
38.45 |
26.90 |
42.91 |
Note: Gems & Jewellery Imports
include Gold, Silver & Pearls, precious & Semi-precious stones
Fig 5: Trade excluding Petroleum and Gems & Jewellery during July 2022
·
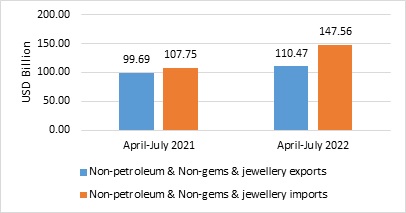
Non-petroleum and non-gems & jewellery exports during April-July 2022 was USD 110.47
Billion, an increase of 10.81 per cent over non-petroleum and non-gems & jewellery exports of USD 99.69 Billion in April-July 2021.
·
Non-petroleum, non-gems & jewellery (gold, silver & precious metals) imports were
USD 147.56 Billion in April-July 2022, recording a positive
growth of 36.94 per cent, as compared to Non-petroleum, non-gems & jewellery imports of USD 107.75 Billion in April-July 2021.
Table 4: Trade excluding Petroleum and Gems & Jewellery during April-July 2022
|
|
April-July
2022 (USD
Billion) |
April-July
2021 (USD
Billion) |
Growth
vis-à-vis April-July 2021 (%) |
|
Non-
petroleum exports |
123.98 |
112.32 |
10.38 |
|
Non-
petroleum imports |
174.40 |
129.81 |
34.35 |
|
Non-petroleum
& Non Gems & Jewellery exports |
110.47 |
99.69 |
10.81 |
|
Non-petroleum
& Non Gems & Jewellery imports |
147.56 |
107.75 |
36.94 |
Note: Gems & Jewellery Imports
include Gold, Silver & Pearls, precious & Semi-precious stones
Fig 6: Trade excluding Petroleum and Gems & Jewellery during April-July 2022
SERVICES TRADE
·
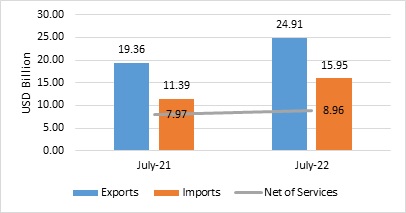
The estimated value of services export
for July 2022* is USD 24.91 Billion, exhibiting a positive
growth of 28.69 per cent vis-a-vis July 2021 (USD 19.36 Billion).
·
The estimated value of services import
for July 2022* is USD 15.95 Billion exhibiting a positive
growth of 40.02 per cent vis-à-vis July 2021 (USD 11.39 Billion).
·
The services trade balance in July
2022* is estimated at USD 8.96 Billion, which is an increase of 12.49 per cent
over July 2021 (USD 7.97 Billion).
Fig 7: Services Trade during July 2022*
·
The estimated value of services export
for April-July 2022* is USD 96.40 Billion, exhibiting a positive
growth of 27.56 per cent vis-a-vis April-July 2021 (USD 75.57 Billion).
·
The estimated value of services imports
for April-July 2022* is USD 60.96 Billion exhibiting a positive
growth of 45.85 per cent vis-à-vis April-July 2021 (USD 41.80 Billion).
·
The services trade balance for
April-July 2022* is estimated at USD 35.44 Billion as against USD 33.77 Billion
in April-July 2021, which is an increase of 4.93 per cent.
Fig 8: Services Trade during April-July 2022*
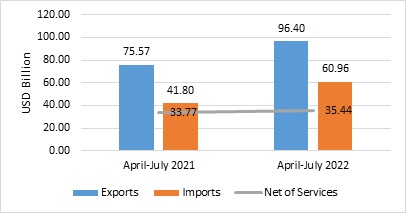
Table 5: Export Growth in Commodity Groups in July 2022
|
Sl.
No. |
Commodities |
(Values
in Million USD) |
%
Change |
|
|
JUL'21 |
JUL'22 |
JUL'22 |
||
|
|
Commodity
groups exhibiting positive growth |
|||
|
1 |
Tobacco |
65.16 |
113.48 |
74.16 |
|
2 |
Electronic
Goods |
1244.20 |
1817.64 |
46.09 |
|
3 |
Coffee |
71.19 |
93.39 |
31.18 |
|
4 |
Rice |
710.94 |
930.50 |
30.88 |
|
5 |
Cereal
preparations & miscellaneous processed items |
182.45 |
227.18 |
24.52 |
|
6 |
Oil
Meals |
65.45 |
80.64 |
23.21 |
|
7 |
Oil
seeds |
76.58 |
92.68 |
21.02 |
|
8 |
Meat,
dairy & poultry products |
256.39 |
308.81 |
20.45 |
|
9 |
Leather
& leather products |
387.72 |
464.38 |
19.77 |
|
10 |
Ceramic
products & glassware |
295.97 |
332.28 |
12.27 |
|
11 |
Tea |
70.07 |
78.33 |
11.79 |
|
12 |
Petroleum
Products |
5840.02 |
6376.21 |
9.18 |
|
13 |
Organic
& Inorganic Chemicals |
2426.09 |
2620.85 |
8.03 |
|
14 |
Fruits
& Vegetables |
220.06 |
234.00 |
6.33 |
|
15 |
Other
cereals |
96.78 |
101.98 |
5.37 |
|
16 |
Spices |
338.42 |
343.53 |
1.51 |
|
17 |
Marine
Products |
701.60 |
711.87 |
1.46 |
|
18 |
Mica,
Coal & Other Ores, Minerals including processed minerals |
406.45 |
409.77 |
0.82 |
|
Sl.
No. |
Commodities |
(Values
in Million USD) |
%
Change |
|
|
JUL'21 |
JUL'22 |
JUL'22 |
||
|
|
Commodity
Groups exhibiting negative growth |
|||
|
19 |
Iron
Ore |
363.20 |
20.58 |
-94.33 |
|
20 |
Handicrafts
excl. hand made carpet |
189.04 |
121.23 |
-35.87 |
|
21 |
Cotton
Yarn/Fabs./made-ups, Handloom Products etc. |
1315.42 |
944.92 |
-28.17 |
|
22 |
Cashew |
36.68 |
26.92 |
-26.61 |
|
23 |
Carpet |
158.23 |
117.75 |
-25.58 |
|
24 |
Man-made
Yarn/Fabs./made-ups etc. |
486.91 |
437.59 |
-10.13 |
|
25 |
Gems
& Jewellery |
3459.67 |
3279.36 |
-5.21 |
|
26 |
Plastic
& Linoleum |
832.61 |
803.25 |
-3.53 |
|
27 |
Engineering
Goods |
9545.20 |
9346.52 |
-2.08 |
|
28 |
Jute
Mfg. including Floor Covering |
39.86 |
39.17 |
-1.73 |
|
29 |
Drugs
& Pharmaceuticals |
2145.67 |
2123.16 |
-1.05 |
|
30 |
RMG
of all Textiles |
1389.22 |
1380.91 |
-0.60 |
Table 6: Import Growth in Commodity Groups in July 2022
|
Sl.
No. |
Commodities |
(Values
in Million USD) |
%
Change |
|
|
JUL'21 |
JUL'22 |
JUL'22 |
||
|
|
Commodity
Groups exhibiting positive growth |
|||
|
1 |
Silver |
11.76 |
1108.86 |
9329.08 |
|
2 |
Project
goods |
42.00 |
198.67 |
373.02 |
|
3 |
Cotton
Raw & Waste |
57.68 |
193.87 |
236.11 |
|
4 |
Coal,
Coke & Briquettes, etc. |
1958.92 |
5179.98 |
164.43 |
|
5 |
Textile
yarn Fabric, made-up articles |
142.36 |
268.82 |
88.83 |
|
6 |
Newsprint |
31.35 |
58.21 |
85.68 |
|
7 |
Petroleum,
Crude & products |
12402.06 |
21133.57 |
70.40 |
|
8 |
Artificial
resins, plastic materials, etc. |
1313.21 |
2191.85 |
66.91 |
|
9 |
Leather
& leather products |
55.77 |
91.05 |
63.26 |
|
10 |
Vegetable
Oil |
1369.58 |
2015.77 |
47.18 |
|
11 |
Metaliferrous
ores & other minerals |
573.04 |
824.99 |
43.97 |
|
12 |
Fertilisers,
Crude & manufactured |
1181.11 |
1691.75 |
43.23 |
|
13 |
Non-ferrous
metals |
1297.09 |
1815.39 |
39.96 |
|
14 |
Wood
& Wood products |
469.43 |
654.82 |
39.49 |
|
15 |
Dyeing/tanning/colouring mtrls. |
269.85 |
369.88 |
37.07 |
|
16 |
Machinery,
electrical & non-electrical |
2821.52 |
3812.61 |
35.13 |
|
17 |
Iron
& Steel |
1336.51 |
1727.91 |
29.29 |
|
18 |
Fruits
& vegetables |
174.57 |
225.08 |
28.93 |
|
19 |
Organic
& Inorganic Chemicals |
2440.47 |
3141.76 |
28.74 |
|
20 |
Electronic
goods |
5319.77 |
6800.89 |
27.84 |
|
21 |
Chemical
material & products |
917.63 |
1172.30 |
27.75 |
|
22 |
Machine
tools |
311.07 |
385.98 |
24.08 |
|
23 |
Pearls,
precious & Semi-precious stones |
2628.17 |
3214.10 |
22.29 |
|
24 |
Pulp
and Waste paper |
134.63 |
155.93 |
15.82 |
|
25 |
Professional
instrument, Optical goods, etc. |
523.64 |
593.57 |
13.35 |
|
26 |
Transport
equipment |
1331.39 |
1371.71 |
3.03 |
|
Sl.
No. |
Commodities |
(Values
in Million USD) |
%
Change |
|
|
JUL'21 |
JUL'22 |
JUL'22 |
||
|
|
Commodity
Groups exhibiting negative growth |
|||
|
27 |
Pulses |
162.03 |
66.05 |
-59.24 |
|
28 |
Sulphur
& Unroasted Iron Pyrites |
29.39 |
14.11 |
-51.99 |
|
29 |
Gold |
4203.06 |
2370.32 |
-43.60 |
|
30 |
Medicinal
& Pharmaceutical products |
795.31 |
710.12 |
-10.71 |
Table 7: MERCHANDISE TRADE
|
EXPORTS
& IMPORTS: (Rs. Crore) |
||
|
(PROVISIONAL) |
||
|
|
JULY |
APRIL-JULY |
|
EXPORTS
(including re-exports) |
|
|
|
2021-22 |
2,64,666.37 |
9,69,332.85 |
|
2022-23 |
2,88,747.71 |
12,24,231.62 |
|
%Growth
2022-23/2021-22 |
9.10 |
26.30 |
|
IMPORTS |
|
|
|
2021-22 |
3,43,919.55 |
12,81,020.08 |
|
2022-23 |
5,27,541.77 |
19,95,937.36 |
|
%Growth
2022-23/2021-22 |
53.39 |
55.81 |
|
TRADE
BALANCE |
|
|
|
2021-22 |
-79,253.18 |
-3,11,687.23 |
|
2022-23 |
-2,38,794.06 |
-7,71,705.73 |
Table 8: SERVICES TRADE
|
EXPORTS
& IMPORTS (SERVICES) : (US $ Billion) |
||
|
(PROVISIONAL) |
June
2022 |
April-June
2022 |
|
EXPORTS
(Receipts) |
25.29 |
71.49 |
|
IMPORTS
(Payments) |
15.77 |
45.01 |
|
TRADE
BALANCE |
9.53 |
26.48 |
|
|
|
|
|
EXPORTS
& IMPORTS (SERVICES): (Rs. Crore) |
||
|
(PROVISIONAL) |
June
2022 |
April-June
2022 |
|
EXPORTS
(Receipts) |
1,97,466.28 |
5,52,079.75 |
|
IMPORTS
(Payments) |
1,23,100.22 |
3,47,617.89 |
|
TRADE
BALANCE |
74,366.06 |
2,04,461.85 |
|
Source:
RBI Press Release dated 1st August 2022 |
||