WTO Cuts Trade Growth by 0.5%
· Only 2.8% Growth Expected in this
year
· Recovery to 3.9% Seem in 2016
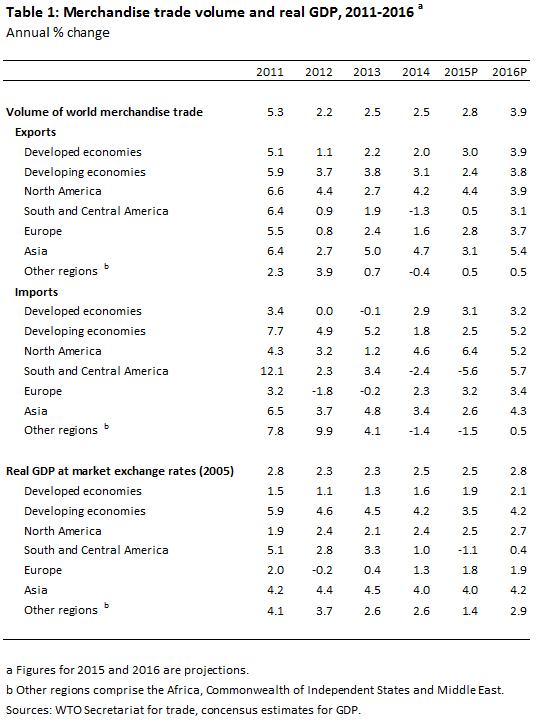
WTO economists have lowered their forecast
for world trade growth in 2015 to 2.8%, from the 3.3%
forecast made in April, and reduced their estimate for 2016 to 3.9% from 4.0%.
These revisions reflect a number of factors that weighed on
the global economy in the first half of 2015, including falling import demand
in China, Brazil and other emerging economies; falling prices for oil and other
primary commodities; and significant exchange rate fluctuations.
Volatility in financial markets, uncertainty over the
changing stance of monetary policy in the United States and mixed recent
economic data have clouded the outlook for the world economy and trade in the
second half of the year and beyond.
If current projections are realised, 2015 will mark the
fourth consecutive year in which annual trade growth has fallen below 3 per
cent and the fourth year where trade has grown at roughly the same rate as
world GDP, rather than twice as fast, as was the case in the 1990s and early
2000s.
Trade values in dollar terms have declined in most countries
since last year and were down roughly 12% year-on-year in July at the world
level. This is partly the result of a strong general appreciation of the US
dollar over this period (+15% in nominal effective terms against major
currencies according to the Bank for International Settlements). As Chart 1
shows, there is generally an inverse relationship between world trade values in
current dollar terms and the value of the US currency. For example, Germany’s
exports and imports were both down 14% year on year in dollar terms in July,
but they were up 6% in euro terms.
Chart 1

The strongest downward revision to the previous export
forecast for 2015 was applied to Asia, where the estimate was lowered to 3.1%
from 5.0% in April. This is mostly due to falling intra-regional trade as
China’s economy has slowed. The downward revision to Asia on the import
side was even stronger, from 5.1% to 2.6%, partly due
to lower Chinese imports which were down 2.2% year-on-year in Q2
(non-seasonally adjusted data). The product composition of China’s merchandise
imports suggests that some of the slowdown may be related to the country’s ongoing transition from investment to consumption led growth.
Large year-on-year drops in quantities of imported machinery (-9%) and metals
(iron and steel -10%, copper 6%) were
recorded in customs statistics for August, while strong increases were recorded
for agricultural products including cereal grains (+130%) and oilseeds (+33%).