WTO Expects Trade Upturn in
2014, 2015
World trade is
expected to grow by a modest 4.7% in 2014 and at a slightly faster rate of 5.3%
in 2015 WTO economists said on 14 April.
Although the 2014 forecast
of 4.7% is more than double the 2.1% increase of last year, it remains below
the 20-year average of 5.3%. For the past two years, growth has averaged only
2.2%.
The sluggish pace of
trade growth in 2013 was due to a combination of flat import demand in
developed economies (-0.2%) and moderate import growth in developing economies
(4.4%). On the export side, both developed and developing economies only
managed to record small, positive increases (1.5% for developed economies, 3.3%
for developing economies).
·
The trade forecast for 2014
has been
upgraded to 4.7% from
4.5%, still
below the 20-year average of 5.3% (1983–2013). A 5.3% increase in trade is anticipated for 2015.
·
Risks to the forecast have
eased in
developed economies but risen in developing countries, as the end of quantitative easing has increased financial market volatility.
·
World merchandise trade
grew 2.1% in 2013 in volume terms,
very close to the 2.3% increase from the previous year.
·
Developing economies trade
flows
turned negative in the middle of 2013, as exports and imports each fell 1% between the first half and the second. Developed economies staged a modest recovery, as exports and imports rose 1% and 1.5%, respectively, during the same period.
“Concluding the Doha
round would provide a strong foundation for trade in the future, and a powerful
stimulus in today’s slow growth environment. We are currently discussing new
ideas and new approaches which would help us to get the job done – and to do it
quickly.”
Chart 1: Growth in volume
of world merchandise exports and GDP, 2005-15 a (Annual % change)
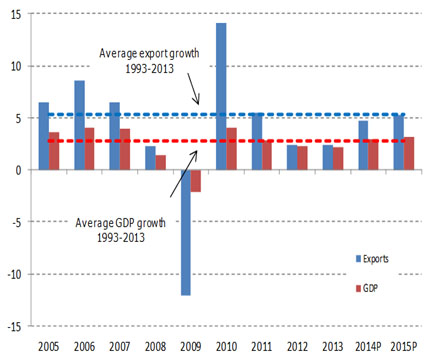
a Figures for 2013 and 2014 are projections.
Source: WTO Secretariat.
Several factors
contributed to the weakness of trade and output in 2013, including the lingering
impact of the EU recession, high unemployment in euro area economies (Germany
being a notable exception), and uncertainty about the timing of the Federal
Reserve’s winding down of its monetary stimulus in the United States. The
latter contributed to financial volatility in developing economies in the
second half of 2013, particularly in certain “emerging” economies with large
current account imbalances.
The preliminary
estimate of 2.1% for world trade growth in 2013 refers to the average of merchandise
exports and imports in volume terms, i.e. adjusted to account for differences
in inflation and exchange rates across countries. This figure is slightly lower
than the WTO’s most recent forecast of 2.5% for 2013, issued last September.
The main reason for the divergence was a stronger than expected decline in
developing economies’ trade flows in the second half of last year. For the
second consecutive year, world trade has grown at roughly the same rate as
world GDP (gross domestic product, a measure of countries’ economic output) at
market exchange rates, rather than twice as fast, as is normally the case
(Chart 1).
Recent business
surveys and industrial production data point to a firming up of the recovery in
the United States and Europe in early 2014. The gradual improvement of US
employment data has allowed the Federal Reserve to proceed with its planned
“tapering”, of their third round of quantitative easing (“QE3”) The outlook for
the European Union has also improved, although growth there will remain uneven
as long as peripheral EU economies continue to underperform core ones. Output
growth in Japan should be slightly lower this year as planned fiscal
consolidation
is implemented.
Finally, despite having hit a soft patch recently, developing economies
(including China) should continue to outpace developed economies in terms of
GDP and trade growth in the coming year, but some could encounter setbacks,
particularly those most exposed to the recalibration of monetary policy in
developed countries.
In 2013, the dollar
value of world merchandise exports rose 2.1% to $18.8 trillion. This growth
rate was slightly less than the WTO’s export volume growth estimate for the
year (+2.4%), which implies that export prices declined slightly from one year
to the next. Meanwhile, the value of world commercial services exports rose
5.5% to $4.6 trillion.
The trade forecast
for 2014 is premised on an assumption of 3.0% growth in world GDP growth at
market exchange rates, while the forecast for 2015 assumes output growth of
3.1%. Note that the GDP figures are consensus estimates and are not WTO
projections. Risks to the trade forecast are still mostly on the downside, but
there is some upside potential, particularly since trade in developed economies
is starting from a low base. However, volatility is likely to be a defining
feature of 2014 as monetary policy in developed economies becomes less
accommodative.
Some developed
economy risks factors have receded considerably since last year’s press
release, including the sovereign debt crisis in Europe and fiscal brinksmanship
between the executive and legislative branches of government in the United
States. Developing economies are now the focus of several gathering risks,
including large current account deficits (e.g. India, Turkey), currency crises
(Argentina), overinvestment in productive capacity, and rebalancing economies
to rely more on domestic consumption and less on external demand.
Geopolitical risks
have introduced an additional element of uncertainty to the forecast. Civil
conflicts and territorial disputes in the Middle East, Asia and Eastern Europe
could provoke higher energy prices and disrupt trade flows if they escalate.
However, since the timing and impact of these kinds of risks are inherently
unpredictable, they are not considered directly in our forecasts.
More details on
trade developments in 2013
The WTO and UNCTAD
jointly produce a variety of short-term trade statistics, including
seasonally-adjusted quarterly merchandise trade volume indices. These are shown
in Chart 2 for the United States, the European Union, Japan and developing Asia
(which includes China).
After a flat first
quarter, US exports grew steadily for the remainder of 2013. In contrast,
exports from the Europe Union to the rest of the world (i.e. extra-EU exports)
were strongest in the first quarter but weakened and turned negative over the
course of the year. Trade between EU countries (i.e. intra-EU exports) rallied
slightly in the third quarter but stalled in other periods. Japan saw its
exports increase in three out of four quarters in 2013, starting from a low
base. Finally, exports from developing Asia treaded water, alternating between
positive and negative but trending flat.
Overall, exports in
the second half of the year were up for the United States (3.3%), intra-EU
(2.0%), and Japan (1.2%), while developing Asia was flat (0.0%) and extra-EU
slightly negative (-1.5%).
On the import side,
extra-EU trade trended down throughout the year, sapping global demand. (The
story for intra-EU imports is the same as for intra-EU exports, see above.)
Meanwhile, US and Japanese imports were generally rising, and developing Asia
was mostly flat, only turning negative in the fourth quarter.
In the second half,
import demand was improving in some large markets (+2.2% for the US, +1.8% for
intra-EU, +0.2% for extra-EU, and +3.3% for Japan), and was slightly negative
in developing Asia (-0.2%). However, exporters will find little relief until EU
imports recover substantially from their current depressed state. (EU
merchandise imports represent 32% of world imports including intra-EU trade,
and 15% of world imports excluding it.)
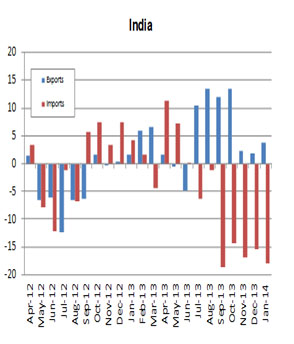
Chart 2: Quarterly merchandise trade flows of selected
economies, 2010Q1-2013Q4
Seasonally adjusted volume indices, 2010Q1=100Source

Although
not shown in Chart 2, quarterly exports and imports of developing economies in
total turned negative in the second half of last year, with exports and imports
each falling around 2% between the second and fourth quarters. South and
Central America’s
trade flows were particularly affected (the region’s exports declined by 3% and
its imports contracted by 5% during the same period) but other natural resource
exporting regions were hit hard as well. However, the declines in developing
regions were roughly cancelled by the rising trend for developed economies.
For
the second time in two years, merchandise trade has grown more slowly than one
would expect given the growth of the world economy as measured by GDP. Although
trade can grow faster or more slowly than output in any given year, since the
1990s it has tended to grow about twice as fast as GDP when measured at market
exchange rates. In 2012 trade growth fell to the same rate as GDP, and they
remained at matching rates in 2013, prompting analysts to question whether the
previous relationship continued to hold.
Chart
3 shows 10-year moving averages of world trade growth, world GDP growth and
their ratio. This ratio peaked at 2.4 in 2000 but has since fallen to 1.7 in
2013. Historically, trade has tended to contract when world output has slowed,
only to rebound sharply afterwards. Structural factors (e.g. the spread of
supply chains, the product composition of world trade, subtle protectionism,
etc.) may have played a role in the declining ratio. However, given the number
and severity of global slowdowns in recent years, the explanation may simply be
cyclical. It is too soon to say whether something like a 2:1 relationship
between trade growth and GDP growth will reassert itself once the global
recovery gains traction, but this variable will bear watching in the future.
Chart 3: 10-year moving
average of world trade, GDP and trade/GDP, 1990-2015
Average
annual % change (left) and ratio (right)

a Figures for 2014 and 2015 are projections.
Source: WTO Secretariat
Additional perspective on the trade
forecast
The
WTO’s forecast of 4.7% growth in world merchandise trade for 2014 is below the
average rate of 5.3% for the last 20 years (1993–2013) and also below the pre-crisis average rate of
6.0% for 1990–2008
(Chart 4). In addition to creating a permanent shift downward in the level of
trade, the global recession of 2008-09 may have reduced its average growth rate
as well. The average rate of trade expansion in the three years since 2010 is
3.42%. Forecasts for 2014 and 2015, if correct, would raise the average to 4%,
but this rate is insufficient to narrow the existing gap.
Chart 4: Volume of world
merchandise exports, 1990-2015a
Indices,
1990=100

a Figures for 2014 and 2015 are projections.
Source: WTO Secretariat
The
divergence between the pre-crisis trend and current levels of world trade continues
to widen. This gap stood at 17.0% of the trend level in 2013 and will rise to
19% by 2014 if our projections are realized, which would place world trade
further below its the pre-crisis trend than it was in 2009 during what
economists have called the “great
trade collapse”
(Chart 5).
In
2012 the EU recession had a significant dampening effect on measured trade
volumes due to the large share of the European Union in world trade (around 1/3
for both exports and imports) and to the fact that, by convention, trade
between EU countries is counted in world trade totals. In last year’s press release, we estimated that
growth in world trade would have been more than a percentage point higher if
the EU was treated as a single entity and intra-EU trade was ignored. A similar
calculation for 2013 did not result in a substantially higher growth rate (2.7%
for world trade excluding intra-EU trade, compared to 2.1% including it)
because although trade within the EU remained depressed it was not declining as
sharply as last year. However, if EU economies recover faster than expected and
trade between them is revitalized, this could cause world trade to surprise on
the upside.
Chart 5: Deviation of
world merchandise export volumes from pre-crisis trends, 2005-15a
percent
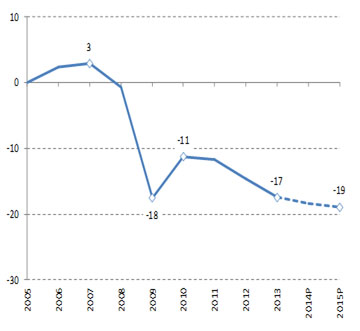
a Figures for 2014 and 2015
are projections.
Source: WTO Secretariat
The state of the world
economy and trade in 2013 and 2014Q1
Economic growth
Output trends in developed
economies were decidedly mixed during 2013. The 2012 recession in the European
Union, which was particularly acute in the euro area, extended into 2013 with a
0.2% contraction in EU GDP the first quarter (annualized rate) according to
data from OECD Quarterly National Accounts. Growth remained positive but tepid
for the rest of the year, ranging between 1.2% and 1.7% annualized.
In
contrast to this performance, the United States saw annualized quarterly growth
reach 4.1% in the third quarter, and roughly 2.5% in both Q2 and Q4. After some
delay, the US Federal Reserve announced in December of last year that it would
begin to wind down its QE3 (third quantitative easing) programme of bond
purchases beginning in January. Initial market reaction was muted but
after-shocks were felt soon enough, mostly in developing economies.
Japan’s experiment with expanded fiscal and
monetary stimulus known as Abenomics” produced stronger growth in the first
two quarters of 2013, but activity slowed in the second half of the year,
falling to less than 1% per quarter, annualized.
For
developed economies taken together, GDP growth for the whole of 2013 was 1.1%,
lower than the 1.3% rate recorded in 2012 and 1.5% expansion of 2011 (Table 1).
Developing
economies’
output slowed in 2013 as financial volatility hit some countries harder than
others. Developing economies including the Commonwealth of Independent States
(CIS) saw their collective GDP growth drop to 4.4% from 4.5% in 2012, down from
5.7% in 2011 (Table 1).
The
rise in financial market volatility was most keenly felt in emerging markets
with large current account deficits. This is especially true of India, where
output growth see-sawed from 2.6% in the second quarter to 7.2% in the third,
then back to 3.9% in the fourth (all rates annualized, sourced from the OECD).
With financial markets anticipating an early tapering of QE3 in mid-2013,
capital flows put pressure on emerging market currencies like India’s Rupee, which suffered a depreciation
of 14.5% between April and September (Chart 6). Other emerging market
currencies also depreciated significantly against the dollar, including the
Argentinean peso, the Turkish lira, the Indonesian rupiah and the South African
rand. Idiosyncratic political shocks contributed further to market turbulence
in Turkey and Thailand.
In
a potentially significant development, China has given its currency greater
leeway to fluctuate against other currencies, and monetary authorities allowed
the RMB to depreciate by 1.5% against the dollar between January and March.
What this portends for the future conduct of Chinese monetary policy remains to
be seen, but Chinese authorities have indicated a desire to gradually move
their currency toward greater convertibility.
Chart 6: US dollar
exchange rates against currencies of selected countries, January 2005 - March
2014
Indices
of US dollars per unit of national currency, 1 January 2005 = 100
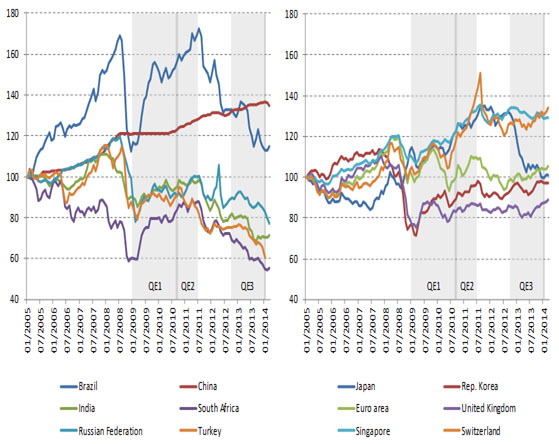
Source: Federal Reserve Bank
of St. Louis except for Russian Federation and Turkey, which are sourced from
IMF International Financial Statistics.
Asia
recorded the fastest GDP growth among WTO geographic regions in 2013 at 4.2%,
which was almost equal to growth in the previous two years. It was followed by
Africa (3.8%), Middle East (3.0%), South and Central America (also 3.0%), the
Commonwealth of Independent States (2.0%), North America (1.8%) and Europe
(0.3%).
Table 1: GDP and
merchandise trade by region, 2011-13
Annual
% change

a Includes
the Caribbean
b Hong Kong, China; Republic of Korea; Singapore and Chinese Taipei
Source: WTO Secretariat.
Merchandise trade in volume (i.e.
real) terms
World
merchandise trade volume as measured by the average of exports and imports rose
2.1% in 2013, but the difference between measured exports and imports was
relatively large (2.4% for exports, 1.8% for imports). Some degree of
divergence between these figures is normal due to imperfect data recording and
may be narrowed by future revisions.
Exports
of developed economies grew more slowly than the world average at 1.5%, while
shipments from developing countries grew faster than average at 3.3%. On the
import side, developed economies recorded a small decline of -0.2%, while
developing economies and CIS increased by 4.4% (Table 1).
Asia’s exports grew faster than any other
region’s last year, with a 4.6% rise. It was followed by North America (2.8%),
Europe (1.5%), the Middle East (also 1.5%), South and Central America (0.7%),
the Commonwealth of Independent States (also 0.7%) and Africa (-3.4%). Asia’s
export growth was held back by Japan, which saw is shipments to the rest of the
world decline by 1.8%. Meanwhile, exports of China and India increased by 7.7%
and 6.7%, respectively. These performances were better than 2012 but still
relatively weak by recent historical standards. The negative figure for Africa
was due to sharp reductions in shipments from petroleum exporting countries,
including Libya (-27%), Nigeria (11%) and Algeria (-7%).
Turning
to imports, the fastest growing region was Asia (4.4%), followed by the Middle
East (4.4%), Africa (4.0%), South and Central America (2.5%), North America
(1.2%), Europe (-0.5%), and the Commonwealth of Independent States (-1.1).
India suffered a sharp drop of 2.9% in its imports as a result of its economic
slowdown, but China’s
purchases from abroad jumped nearly 10%.
Africa
was able to increase its imports even as its exports fell in 2013 due to
continued high primary commodity prices. Although prices for metals, raw
materials, and beverages (including coffee, tea and cocoa) have fallen in the
last 2 years, oil prices have been remarkably steady, rising 1% in 2012 and
falling 2% in 2013. Primary commodity prices in general only fell 2% last year
(Table 2).
Table 2: World prices of
selected primary products, 2000-13
Annual
% change and $/Barrel
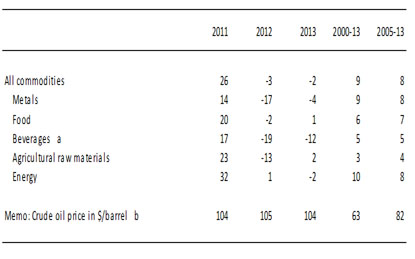
a Comprising coffee, cocoa
beans and tea.
b Average of Brent, Dubai, and West
Texas Intermediate.
Source: IMF
International Financial Statistics.
Merchandise and commercial services
trade in value (i.e. dollar) terms
The
dollar value of world merchandise exports in 2013 was $18.8 trillion, 2% higher
than in 2012. The growth of world merchandise exports in current dollar terms
was nearly equal to the growth of exports in volume terms since prices of
traded goods as measured by unit values were nearly unchanged from one year to
the next. The average growth rate of export values in the post-2005 period
remained stable at 8% (Table 3). One much remarked upon development in 2013 was
the fact that China became the largest trader as measured by the sum of exports
and imports (11.0% of world), overtaking the United States (10.4%). However, if
the EU is treated as a single entity its share in world exports plus imports
excluding intra-EU trade remains the largest, 15.1% compared to China's 13.8%.
Meanwhile,
world commercial services exports in 2013 reached $4.6 trillion, with a growth
rate of 6%. The 2013 growth rate for transport services was below world
commercial services exports at 2%, while travel services grew at 7% and other
commercial services grew at 6% (Table 3).
Commercial
services accounted for 20% of total world trade in world goods and commercial
services in 2013, up 1% from the 2012 share. It should be noted that
traditional trade statistics, which measure gross trade flows rather than value
added at various stages of production, may strongly underestimate the
contribution of services to international trade.
In
dollar terms, China’s
exports of financial services rose 52% to $3 billion in 2013, although the
United States remained the top supplier with exports valued at $82 billion.
Other notable changes include China’s
displacing of France to become the fourth largest exporter of other business
services.
Table 3: World exports of
merchandise and commercial services, 2005-13
$bn and annual % change

Source: WTO Secretariat
estimates for merchandise and WTO and UNCTAD Secretariat estimates for
commercial services.
Some sub-categories of other commercial services grew faster than others. Insurance services and computer and information services recorded the strongest growth at 8%, while construction posted the only decline at -3%. Financial services (i.e. services provided by banks and other financial intermediaries) posted the strongest recovery from a decline of -3% in 2012 to growth of 7% in 2013. Communications services (including postal, courier and telecommunications services) grew at a modest 2% rate and other business services (including engineering services, legal/accounting services, management consulting, advertising and trade related services among others) grew 7%. Royalties and licence fees increased by 6% after stagnating in 2012. However, all sub-categories of other commercial services recorded lower-than-trend growth rates.
Appendix
tables 1 to 6 more provide detailed information on nominal merchandise and
commercial services trade flows by region and for selected economies. They also
include tables of leading exporters and importers with and without trade
between EU states. There were few significant moves up or down in world
rankings last year.
China
overtook Germany as the second largest importer of commercial services compared
to last year’s tables, while France moved into fourth position pushing the
United Kingdom to fifth place.
Year-on-year
growth in commercial services exports by region for 2011-13 are shown in Chart
7, below, and in Appendix Table 2. Imports are not shown in the chart, but
their appearance is similar, with sharp declines between 2011 and 2012 for most
regions, followed by smaller changes (some positive, some negative) between 2012
and 2013. On both the export and import sides, growth in European services
trade turned sharply negative in 2012 before rebounding into positive territory
in 2013.
The
strongest decelerations were recorded by South and Central America, for both
exports and imports, with Brazil responsible for much of the decline. On the
export side, growth fell from 18% in 2011 to 6% in 2012, to 1% in 2013. On the
import side it dropped from 23% in 2011 to 7% in 2012 to 6% in 2013.
Chart
7: Growth in the value of commercial services exports by region, 2011 — 13
Annual
% change
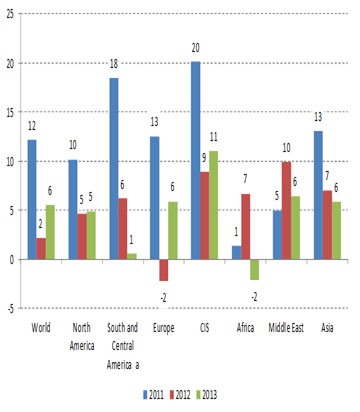
a Includes the Caribbean
Source: WTO
Secretariat.
Merchandise trade details
North
America’s merchandise exports rose 1.9% in 2013 to $2.42 trillion (12.9% of
world exports) while imports remained essentially unchanged at $3.20 trillion
(16.9% of world imports). South and Central America’s exports fell by 1.8% to $737 billion
(3.9%) but the region’s
imports grew by 2.4% to $773 billion (4.1%). European exports rose 4.0% to
$6.64 trillion (35.3%), the strongest growth of any region. Meanwhile, Europe’s imports recorded a small increase of
1.0% to $6.59 trillion (34.9%).
Exports
of the Commonwealth of Independent States declined 2.8% to $778 billion while
imports grew by 0.7% to $575 billion. Respectively, the region’s exports and imports represented 4.1
and 3.0% of world trade.
Africa’s exports suffered a large decline of
6.3% to $599 billion (3.2% of world exports). Meanwhile imports grew a modest
2.2% to $628 billion (3.3% of world imports). Middle East exports declined by
1.3% to $1.33 trillion (or 7.1%) and the region’s imports rose by 4.3% to $770 billion (4.1%).
Finally,
Asia’s exports grew by 2.8% to $6.29
trillion (33.5% of the global total) in 2013. Meanwhile, imports grew by 2.1%
to $6.37 trillion (33.6%).
The
top five merchandise exporters in 2013 were China ($2.21 trillion, 11.8% of
world exports), the United States ($1.58 trillion, 8.4%), Germany ($1.45
trillion, 7.7%), Japan ($715 billion, 3.8%) and the Netherlands ($664 billion,
3.5%). There were no changes in rank among the top exporters, although Japan
suffered a sharp decline of 10.5% in exports.
The
leading importers were the United States ($2.33 trillion, 12.4% of world
imports), China ($1.95 trillion, 10.3%), Germany ($1.19 trillion, 6.3%), Japan
($833 billion, 4.4%) and France ($681 billion, 3.6%). France replaces the
United Kingdom at number five on the list of leading importers.
If
we count all 28 European Union members as a single entity and exclude intra-EU
trade, the leading exporters were the European Union ($2.30 trillion, or 15.3%
of world exports), China (14.7%), the United States (10.5%), Japan (4.8%) and
the Republic of Korea ($560 billion, 3.7%). The leading importers when intra-EU
trade is excluded were the United States (15.4% of world imports), the European
Union ($2.23 trillion, 14.8%), China (12.9%), Japan (5.5%), and Hong Kong,
China ($622 billion, 4.1%).
Merchandise trade developments by
manufacturing sector
Chart
8 shows estimated year-on-year growth in the dollar value world trade for
selected categories of manufactured goods. Growth turned negative for most
products, except for office and telecom equipment, at the beginning of 2012,
and remained negative until mid-2013. By 2013Q2 most categories had returned to
positive (albeit slow) year-on-year growth, but even as late as Q4 iron and steel
remained below its level of one year earlier.
Iron
and steel trade is a very pro-cyclical and somewhat lagging indicator of
economic activity. At the beginning of 2013 world trade in iron and steel was
down 10% compared to a year earlier, but by the end of the year it was still
down 4%.
Automotive
products trade is equally cyclical but leading. In the first quarter of 2013
trade in vehicles and parts had dropped 4% from its level a year earlier, but
by Q4 trade in automotive products was 9% higher than a year earlier. This
rebound bodes well for the economic recovery and for trade in inputs to
automobile production, including iron and steel, electronics and various raw
materials.
Chart 8: Quarterly world
exports of manufactured goods by product, 2008Q1-2013Q4
Year-on-year
% change in US dollar values

Source: WTO Secretariat
estimates based on mirror data for available reporters in the Global Trade
Atlas database, Global trade Information Systems.
Prospects for 2014 and 2015
Prospects
for world trade and output in 2014 and 2015 are better than they have been for
some time, but leading economies remain fragile, including some of the most
dynamic developing countries that until recently were propping up global
demand. Downside risks to trade abound, but significant upside potential also
exists, as the US economy seems to be gaining momentum and the European Union
appears to have turned a corner. At the same time, developing economies have
slowed appreciably, for a variety of reasons both internal and external. Which
of these forces is stronger may determine how world trade evolves over the next
1 to 2 years.
In
order to provide a more complete picture of the trade outlook, the WTO has
produced more detailed forecasts this year, including breakdowns by geographic
region and by level of development (Table 4). Forecasts for North America,
South and Central America, Europe and Asia are shown separately, whereas data
for Africa, the Middle East and the CIS are aggregated together due to their
economic similarity as petroleum exporting regions, and also because statistics
for these regions rely more on estimation due to incomplete data.
World
merchandise trade is expected to post a 4.7% increase in 2014, with developed
economies growing 3.6% and developing economies and the CIS advancing 6.4%. We
expect that exports from Asia will grow faster than those from any other region
(6.9%). Asia should be followed by North America (4.6%), South and Central
America (4.4%), Europe (3.3%), and Other regions (3.1%), an aggregate that
includes Africa, CIS and Middle East. Exports will be supported by rising
import demand on the part of developed countries as the US economy gains
momentum, and by improving economic conditions in Europe. However, the extent
of the gains will be limited by the high level of unemployment in European
countries and the still considerable amount of slack in the US labour market
due to low labour force participation.
On
the import side, the 4.7% increase in world trade in 2014 will be split between
developed economies growing at 3.4%, and developing economies growing at 6.3%.
Asia should also lead all regions in import growth in 2014 (6.4%), followed by Other regions (5.8%), South and Central America (4.1%),
North America (3.9%), and finally Europe (3.2%). However, Asian import growth
is likely to be unbalanced, with larger gains in China and smaller increases in
other developing Asian economies.
Two
year forecasts are provisional estimates based on strong assumptions about the
medium-term trajectory of gross domestic product (GDP) and should be
interpreted with care. Merchandise trade is projected to grow by 5.3% in 2015,
with developed and developing economies posting increases of 4.3% and 6.8%,
respectively, on the export side, as well as gains of 3.9% and 7.1% on the
import side. For the year we expect to see Asia’s exports grow faster than in 2014 (7.2%), followed by
those of South and Central America (5.5%), North
America (4.5%), Europe (4.3%), and Other regions (4.2%). In 2015, import growth
of Asia should accelerate to 7.0%. Other regions will have the second fastest
import growth (6.6%) followed by South and Central America (5.2%), North
America (5.1%) and Europe (3.4%).
Trade
growth this year could fall short of estimates if some downside risks emerge,
including financial turbulence in emerging markets related to the conduct of
monetary policy in the United States and other developed countries. Better than
expected growth in the US could actually provoke further instability in
developing economies as it might be interpreted as portending earlier interest
rate rises. This in turn could trigger further capital outflows from the
developing world as investors seek improved returns in developed countries.
However, the prospect of deflation in the euro area suggests that monetary
policy in developed countries could as easily become looser rather than
tighter.
Table 4: World merchandise
trade and GDP, 2010-2015a
Annual
% change
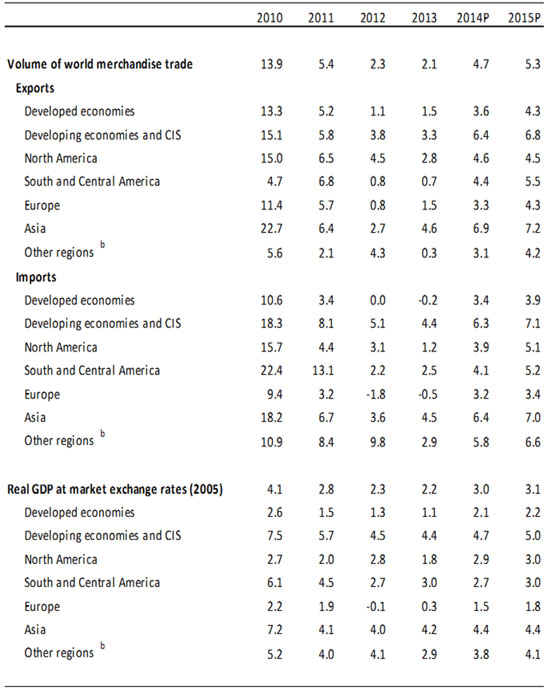
a Figures for 2014 and 2015
are projections.
b Other regions comprises the Africa,
CIS and Middle East
Source: WTO
Secretariat for trade, concensus estimates for GDP.
The
high level of joblessness in the euro area could act as a brake on global import
demand for some time to come since unemployment rates tend to decline only
gradually. The recent experience of the United States gives us an indication of
how much time might be required. From its peak at just under 10% in March of
2010, it took 44 months -
more than three and a half years - for the US unemployment rate to fall to 7%
(Chart 9). Until the EU rate comes down, European demand will likely only
provide marginal support for stronger global trade growth.
Chart 9: Unemployment rates in the European Union (28), the
euro area, the United States and Japan, 2010Q1-2013Q4
Annualized % change over previous quarter
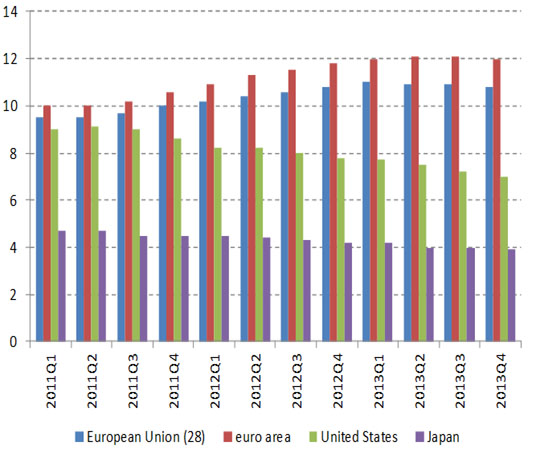
Source:
OECD Labour Force Statistics
India Keeps 19th Position in
World Exports but Moves Down to 12th Place in World Imports
China Maintains 1st in Exports with 11.8% World Share
Merchandise Trade: Leading Exporters and Importers,
2013
|
$bn and % |
|||||||||||
|
Rank 2013 |
Rank 2012 |
Exporters |
Value |
Share |
Annual % change |
Rank 2013 |
Rank 2012 |
Importers |
Value |
Share |
Annual % change |
|
1 |
(1) |
China |
2210 |
11.8 |
8 |
1 |
(1) |
United States |
2331 |
12.4 |
0 |
|
2 |
(2) |
United States |
1579 |
8.4 |
2 |
2 |
(2) |
China |
1950 |
10.3 |
7 |
|
3 |
(3) |
Germany |
1453 |
7.7 |
3 |
3 |
(3) |
Germany |
1187 |
6.3 |
2 |
|
4 |
(4) |
Japan |
715 |
3.8 |
-10 |
4 |
(4) |
Japan |
833 |
4.4 |
-6 |
|
5 |
(5) |
Netherlands |
664 |
3.5 |
1 |
5 |
(6) |
France |
681 |
3.6 |
1 |
|
6 |
(6) |
France |
580 |
3.1 |
2 |
6 |
(5) |
United Kingdom |
654 |
3.5 |
-5 |
|
7 |
(7) |
Korea, Republic of |
560 |
3.0 |
2 |
7 |
(8) |
Hong Kong, China |
622 |
3.3 |
12 |
|
|
|
|
|
|
|
|
|
retained imports |
141 |
0.7 |
4 |
|
8 |
(11) |
United Kingdom |
541 |
2.9 |
15 |
8 |
(7) |
Netherlands |
590 |
3.1 |
0 |
|
9 |
(10) |
Hong Kong, China |
536 |
2.9 |
9 |
9 |
(9) |
Korea, Republic of |
516 |
2.7 |
-1 |
|
|
|
domestic exports |
20 |
0.1 |
-11 |
|
|
|
|
|
|
|
|
|
re-exports |
516 |
2.7 |
10 |
|
|
|
|
|
|
|
10 |
(8) |
Russian Federation |
523 |
2.8 |
-1 |
10 |
(11) |
Italy |
477 |
2.5 |
-2 |
|
11 |
(9) |
Italy |
518 |
2.8 |
3 |
11 |
(12) |
Canada a |
474 |
2.5 |
0 |
|
12 |
(13) |
Belgium |
469 |
2.5 |
5 |
12 |
(10) |
India |
466 |
2.5 |
-5 |
|
13 |
(12) |
Canada |
458 |
2.4 |
1 |
13 |
(13) |
Belgium |
450 |
2.4 |
3 |
|
14 |
(14) |
Singapore |
410 |
2.2 |
0 |
14 |
(14) |
Mexico |
391 |
2.1 |
3 |
|
|
|
domestic exports |
219 |
1.2 |
-4 |
|
|
|
|
|
|
|
|
|
re-exports |
191 |
1.0 |
6 |
|
|
|
|
|
|
|
15 |
(16) |
Mexico |
380 |
2.0 |
3 |
15 |
(15) |
Singapore |
373 |
2.0 |
-2 |
|
|
|
|
|
|
|
|
|
retained imports b |
182 |
1.0 |
-9 |
|
16 |
(15) |
Saudi Arabia, Kingdom of c |
376 |
2.0 |
-3 |
16 |
(16) |
Russian Federation a |
344 |
1.8 |
3 |
|
17 |
(18) |
United Arab Emirates c |
365 |
1.9 |
4 |
17 |
(17) |
Spain |
339 |
1.8 |
0 |
|
18 |
(20) |
Spain |
316 |
1.7 |
7 |
18 |
(18) |
Taipei, Chinese |
270 |
1.4 |
0 |
|
19 |
(19) |
India |
312 |
1.7 |
5 |
19 |
(21) |
Turkey |
252 |
1.3 |
6 |
|
20 |
(17) |
Taipei, Chinese |
305 |
1.6 |
1 |
20 |
(20) |
Thailand |
251 |
1.3 |
0 |
|
21 |
(21) |
Australia |
253 |
1.3 |
-1 |
21 |
(22) |
Brazil |
250 |
1.3 |
7 |
|
22 |
(22) |
Brazil |
242 |
1.3 |
0 |
22 |
(23) |
United Arab Emirates c |
245 |
1.3 |
7 |
|
23 |
(25) |
Switzerland |
229 |
1.2 |
1 |
23 |
(19) |
Australia |
242 |
1.3 |
-7 |
|
24 |
(23) |
Thailand |
229 |
1.2 |
0 |
24 |
(25) |
Malaysia |
206 |
1.1 |
5 |
|
25 |
(24) |
Malaysia |
228 |
1.2 |
0 |
25 |
(26) |
Poland |
204 |
1.1 |
2 |
|
26 |
(27) |
Poland |
202 |
1.1 |
9 |
26 |
(24) |
Switzerland |
200 |
1.1 |
1 |
|
27 |
(26) |
Indonesia |
184 |
1.0 |
-3 |
27 |
(27) |
Indonesia |
187 |
1.0 |
-2 |
|
28 |
(29) |
Austria |
174 |
0.9 |
5 |
28 |
(28) |
Austria |
182 |
1.0 |
2 |
|
29 |
(28) |
Sweden |
167 |
0.9 |
-3 |
29 |
(30) |
Saudi Arabia, Kingdom of |
164 |
0.9 |
5 |
|
30 |
|
Czech Republic |
161 |
0.9 |
3 |
30 |
(29) |
Sweden |
158 |
0.8 |
-3 |
|
|
|
Total of above d |
15339 |
81.7 |
- |
|
|
Total of above d |
15492 |
82.1 |
- |
|
|
|
World d |
18784 |
100.0 |
2 |
|
|
World d |
18874 |
100.0 |
1 |
World prices of
selected primary products, 2000-13
Annual % change and $/Barrel
|
|
2011 |
2012 |
2013 |
2000-13 |
2005-13 |
|
All commodities |
26 |
-3 |
-2 |
9 |
8 |
|
Metals |
14 |
-17 |
-4 |
9 |
8 |
|
Food |
20 |
-2 |
1 |
6 |
7 |
|
Beverages a |
17 |
-19 |
-12 |
5 |
5 |
|
Agricultural raw
materials |
23 |
-13 |
2 |
3 |
4 |
|
Energy |
32 |
1 |
-2 |
10 |
8 |
|
Memo: Crude oil
price in $/barrel b |
104 |
105 |
104 |
63 |
82 |
a.
Comprising coffee, cocoa beans and tea
b.
Average of Brent, Dubai and West Texas Intermediate
Source: IMF International Financial
Statistics.