WTO Forecasts Fall of 1.6% in 2014 Trade
New Rate Pegged at
3.1%, 2015 Forecast Cut to 4.0%
WTO economists have reduced their forecast
for world trade growth in 2014 to 3.1% (down from the 4.7% forecast made in
April) and cut their estimate for 2015 to 4.0% from 5.3% previously.
The downgrade comes in response to weaker-than-expected GDP
growth and muted import demand in the first half of 2014, particularly in
natural resource exporting regions such as South and Central America.
“In light of this, the WTO’s forecasts for trade growth have
also been revised downwards for 2014 and 2015. Uneven growth and continuing
geopolitical tensions will remain a risk for both trade and output in the
second half of the year.
When the last forecast was released in April 2014, conditions
for stronger trade growth appeared to be falling into place after a two year
slump that saw world merchandise trade grow just 2.2% on average during
2012–13, roughly equal to the rate of growth of world gross domestic product
(GDP). Leading indicators at the time pointed to an upturn in developed
economies and Europe in particular.
Although growth has strengthened somewhat in 2014, it has
remained unsteady. Output fell in the first quarter in the United States
(–2.1%, annualized rates) and in the second quarter in Germany (–0.6%), sapping
global import demand. China’s GDP growth also slowed from 7.7% in 2013 to 6.1%
in the first quarter of 2014 before rebounding in the second. The slow first
quarter contributed to weak exports in trading partners.
Tensions between the European Union and the United States on
the one hand and the Russian Federation on the other over Ukraine have already
resulted in trade sanctions on certain agricultural commodities, and the number
of products affected could widen if the crisis persists. Conflict in the Middle
East is also stoking uncertainty, and could lead to a spike in oil prices if
the security of oil supplies is threatened. Finally, an outbreak of Ebola
haemorrhagic fever in West Africa has proven difficult to contain, and any
spread of the disease could trigger a broader panic with major economic
implications for West Africa, and perhaps even beyond the region.
Asia recorded the fastest export growth of any region in the
first half of 2014, with a 4.2% rise over the same period last year. It was
followed by North America (3.3%), Europe (1.2%), South and Central America(–0.8%), and Other regions (–2.0%). North America led
all regions on the import sidewith growth of 3.0%,
followed by Asia (2.1%), Europe (1.9%), Other regions (“0.4) and South America
(–3.4%).
Table 1: World merchandise trade and GDP,
2010-2015 a
Annual
% change
|
|
2010 |
2011 |
2012 |
2013 |
2014P |
2015P |
|
Volume
of world merchandise trade |
13.9 |
5.4 |
2.3 |
2.2 |
3.1 |
4.0 |
|
Exports |
|
|
|
|
|
|
|
Developed
economies |
13.4 |
5.2 |
1.1 |
1.5 |
2.5 |
3.8 |
|
Developing
economies |
15.0 |
5.5 |
4.1 |
3.9 |
4.0 |
4.5 |
|
North
America |
15.0 |
6.6 |
4.4 |
2.8 |
3.7 |
3.9 |
|
South
and Central America |
4.7 |
6.8 |
0.7 |
1.4 |
0.4 |
3.2 |
|
Europe |
11.6 |
5.6 |
0.8 |
1.5 |
2.3 |
3.5 |
|
Asia |
22.6 |
6.4 |
2.8 |
4.7 |
5.0 |
4.8 |
|
Other
regions b |
6.0 |
1.9 |
4.2 |
0.6 |
-0.1 |
4.2 |
|
Imports |
|
|
|
|
|
|
|
Developed
economies |
10.9 |
3.4 |
0.0 |
-0.3 |
3.4 |
3.7 |
|
Developing
economies |
18.2 |
7.7 |
5.4 |
5.3 |
2.6 |
4.5 |
|
North
America |
15.7 |
4.4 |
3.1 |
1.2 |
3.9 |
4.2 |
|
South
and Central America |
22.4 |
13.0 |
2.3 |
3.1 |
-0.7 |
4.8 |
|
Europe |
9.8 |
3.2 |
-1.8 |
-0.5 |
2.5 |
3.5 |
|
Asia |
18.1 |
6.6 |
3.7 |
4.5 |
4.0 |
4.3 |
|
Other
regions b |
11.4 |
8.3 |
10.1 |
3.3 |
1.3 |
3.5 |
|
Real
GDP at market exchange rates (2005) |
4.1 |
2.8 |
2.2 |
2.3 |
2.6 |
3.1 |
|
Developed
economies |
2.6 |
1.4 |
1.1 |
1.3 |
1.8 |
2.2 |
|
Developing
economies |
7.5 |
5.8 |
4.6 |
4.4 |
4.3 |
4.9 |
|
North
America |
2.7 |
1.8 |
2.3 |
2.1 |
2.1 |
3.1 |
|
South
and Central America |
6.1 |
4.5 |
2.5 |
3.2 |
1.2 |
2.4 |
|
Europe |
2.2 |
2.0 |
-0.2 |
0.3 |
1.4 |
1.7 |
|
Asia |
7.2 |
4.2 |
4.2 |
4.2 |
4.6 |
4.5 |
|
Other
regions b |
5.2 |
4.0 |
4.2 |
2.8 |
2.9 |
3.9 |
a Figures for 2014 and 2015 are projections.
b Other regions comprise the Africa,
Commonwealth of Independent States and Middle East.
Sources:
WTO Secretariat for trade, consensus estimates for GDP.
On the export side, the WTO anticipates a 2.5% increase in
shipments from developed economies in 2014, followed by a 3.8% rise in 2015.
Meanwhile, exports of developing economies are expected to grow by 4.0% in 2014
and 4.5% in 2015. Imports of developed economies are forecast to rise 3.4% this
year and 3.7% next year, while those of developing economies increase 2.6% in
2014 and 4.5% in 2015.
Perhaps the most noteworthy aspect of Table 1 is the prediction
of weak or even negative trade growth in South and Central America and Others
regions (i.e. Africa, CIS and Middle East) in 2014. Economies in these regions
have been negatively affected by a combination of civil conflict, weak non-fuel
commodity prices, and the easing of growth in previously buoyant trading
partners in Asia. Another notable point is the fact that North America’s import
demand held up relatively well despite the GDP slowdown in the first quarter
(Q1).
NATURAL RESOURCES
TRADE
(Non-seasonally
adjusted volume indices, 2010Q1=100)

Source: WTO Secretariat.
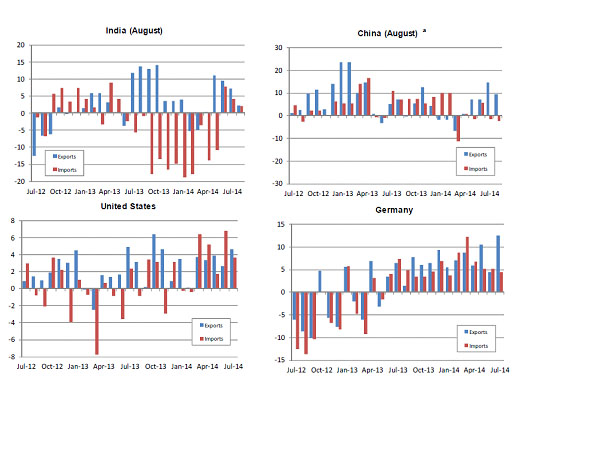
Finally, nominal merchandise trade statistics in current
dollar terms may provide a better indication of current trade trends than
statistics in volume terms since the former are generally timelier. These are
shown in Chart 4 for selected major traders through July or August depending on
data availability. In the chart we observe that year-on-year growth in exports
and imports remained positive in the United States in July (+5% and +4%,
respectively), as it did in the European Union (+4% and +7% for total trade).
Meanwhile, although China’s exports were up 9% in August, the country’s imports
fell 2%. Overall, the trade figures in dollar terms appear to be holding steady
and showing modest growth.
Merchandise exports and imports, July 2012-July 2014
(Year-on-year
percentage change in current dollar values)
a January and February averaged to
minimize distortions due to lunar new year.
Source: IMF International
Financial Statistics, Global Trade Information Services GTA database, national
statistics.