WTO Says World Trade Growth Falls to 2.5%
in 2012
Recovery
in 2013 to only 4.5% Rise
Slowing global output growth has led WTO economists
to downgrade their 2012 forecast for world trade expansion to 2.5% from 3.7% and
to scale back their 2013 estimate to 4.5% from 5.6%.
The global economy has encountered increasingly
strong headwinds since the last WTO Secretariat forecast was issued in April.
Output and employment data in the United States have continued to disappoint,
while purchasing managers’ indices and industrial production figures in China
point to slower growth in the world’s largest exporter.
More importantly, the European sovereign debt
crisis has not abated, making fiscal adjustment in the peripheral euro area
economies more painful and stoking volatility. Figures for world trade include
trade between EU countries (i.e. EU intra-trade), making them highly sensitive
to developments in this region.
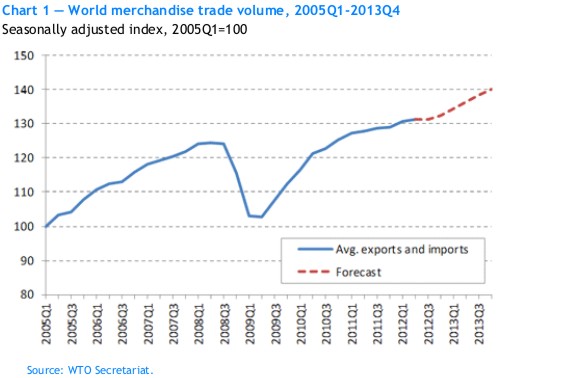
All of these factors have contributed to an easing
of global trade growth, which slowed to a crawl in the second quarter according
to new quarterly merchandise trade volume statistics compiled by the WTO (Chart
1 and box).
The volume of world trade as measured by the
average of exports and imports only managed to grow 0.3% in the second quarter
compared to the first, or 1.2% at an annualized rate.
The trade slowdown in the first half of 2012 was
driven by an even stronger deceleration in imports of developed countries and
by a corresponding weakness in the exports of developing economies, which for
the purposes of this analysis includes the Commonwealth of Independent States.
The WTO now expects world merchandise trade volume
to grow by 2.5% in 2012 (down from 3.7% in April). On the export side, we
anticipate a 1.5% increase in developed economies’ trade (down from 2%) and a
3.5% expansion for developing countries (down from 5.6%). On the import side,
we foresee nearly stagnant growth of 0.4% in developed economies (down sharply
from 1.9%) and a more robust 5.4% increase in developing countries (down from
6.2%).
Table
1: World merchandise trade volume and GDP, 2008-2013a
|
Annual % change |
||||||
|
|
2008 |
2009 |
2010 |
2011 |
2012a |
2013a |
|
Volume of World
Merchandise Tradeb |
2.3 |
-12.5 |
13.9 |
5.0 |
2.5 |
4.5 |
|
Exports |
|
|
|
|
|
|
|
Developed
Economies |
0.9 |
-15.2 |
13.0 |
4.6 |
1.5 |
3.3 |
|
Developing
Economies and CIS |
4.3 |
-7.8 |
15.3 |
5.3 |
3.5 |
5.7 |
|
Imports |
|
|
|
|
|
|
|
Developed
Economies |
-1.1 |
-14.4 |
11.0 |
2.9 |
0.4 |
3.4 |
|
Developing
Economies and CIS |
8.6 |
-10.5 |
18.3 |
8.3 |
5.4 |
6.1 |
|
Real GDP at market
exchange rate |
1.3 |
-2.4 |
3.8 |
2.4 |
2.1 |
2.4 |
|
Developed
Economies |
0.0 |
-3.8 |
2.7 |
1.5 |
1.2 |
1.5 |
|
Developing
Economies and CIS |
5.6 |
2.2 |
7.3 |
5.3 |
4.9 |
5.2 |
a Figures for 2012 and 2013 are
projections.
b Average of exports and imports.
Source:
WTO Secretariat for trade, consensus estimates of economic forecasters for GDP.
Figures for 2013 are provisional estimates based on
strong assumptions about medium-term economic developments, including:
i. that current policy measures will be
sufficient to avert a breakup of the euro, and
ii. an agreement will be
reached to stabilize public finances in the United States, thereby avoiding
automatic spending cuts and tax increases early next year.
Failure of these and other assumptions could derail
the latest projections.
As a result, these figures should be interpreted
with caution. Based on current information, the WTO expects trade growth to
rebound to 4.5% in 2013. Exports of developed and developing economies should
increase by 3.3% and 5.7%, respectively, while imports of developed and
developing countries should advance 3.4% and 6.1%.
Although developed countries collectively recorded
modest increases in both exports and importsin2012, some grew faster than
others.
Exports of the United States and shipments from the
EU to the rest of the world (i.e. extra-EU exports) grew steadily over the past
year, with year-on-year increases of around 7% and 5%, respectively, in the
second quarter.
Japanese exports have been mostly flat since
mid-2010, but even they recorded an 8.5% year-on-year increase in the second
quarter. Imports of the United States and Japan have also held up relatively
well despite the crisis, with year-on-year growth of roughly 5% and 6% in the
latest period.
However, import demand in the
European Union has weakened significantly, resulting in less tradebetween EU countries (intra-trade down3.5%
year-on-year in the second quarter) and fewer imports from the rest of the
world (also down 3.5%). The weight of the EU in total world trade (around 35%
on both the export and import sides in 2011, including EU-intra trade),
combined with the larger-than-expected year-on-year drop in EU imports through
the first half of 2012, explains much of the downward revision to the forecast.
The EU also represents nearly 60% of developed economies’ imports, which
accounts for the stagnation in projected imports of developed economies in
2012.
Weak import demand in developed countries and
softer domestic demand in China have contributed to sagging trade flows in the developing
world, most noticeably in dynamic export-oriented economies in Asia.
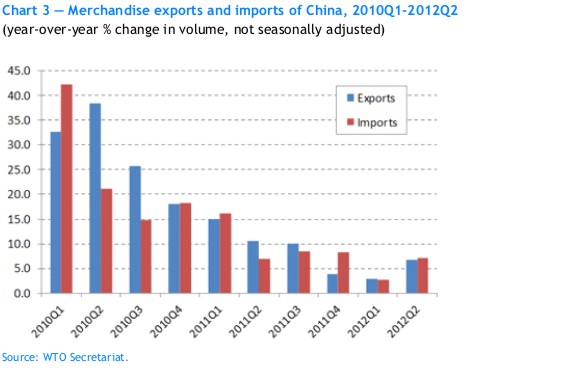
Chart 3 shows year-on-year growth in China’s
merchandise trade flows in volume terms (not seasonally adjusted), which have
declined steadily over the last two and a half years. Export growth dropped to
2.9% and import growth fell to 2.8% in the first quarter of 2012 before
rebounding slightly in the second quarter, but available monthly data suggest
that the third quarter results may be weaker still.
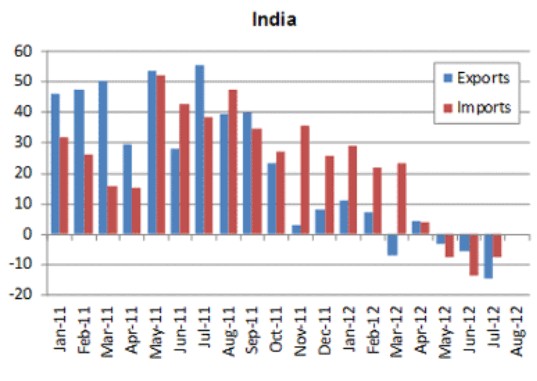
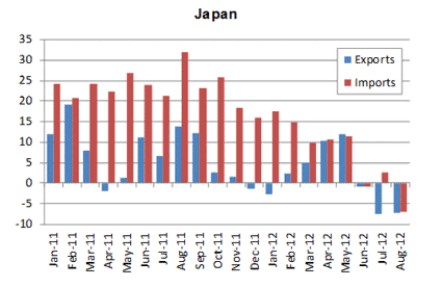
Year-on-year growth in monthly
merchandise exports and imports for selected economies in current dollar terms,
including partial data for the third quarter. Those
economies that have already reported figures for August show either stagnation
(e.g. China) or decline (e.g. Brazil, Japan, Singapore), which suggests
that that the recent weakness of trade will persist into the third quarter.