Commerce Claims 1.8%
Jump in Exports in Q2 over Q1
World
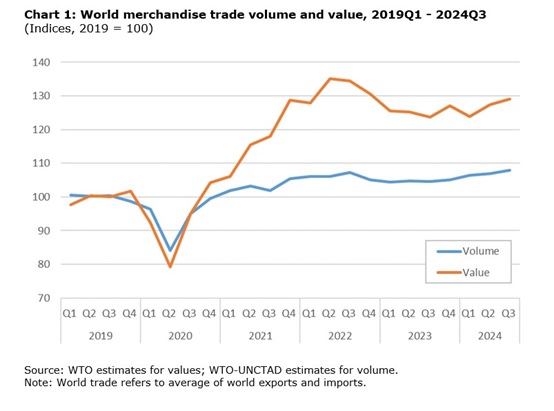
merchandise trade volume rose 1.1% quarter-on-quarter and 3.3% year-on-year, on
a seasonally adjusted basis, in the third quarter of 2024, marking the fourth consecutive
quarter of moderate trade expansion.
By
comparison, merchandise trade in current US dollar terms was up 4.3% year-on-year
in Q3. This represents a significant improvement from the 1.8% increase seen in
Q2 and the 1.4% contraction observed in Q1.
For
the year through September, trade volume was up 2.4% compared to the same period
in 2023, slightly less than the WTO's most recent forecast of 2.7% for 2024 issued
on 10 October. Meanwhile, the value of merchandise trade was up 1.6% over 2023.
Slower trade growth in value terms than in volume terms implies a small (less than
1%) decline in prices of traded goods during this period.
The
projected 2.7% increase in the volume of world merchandise trade in 2024 is attainable
if quarter-on-quarter growth in Q4 continues at around the same rate as in Q3. This
is quite likely since the most recent WTO Goods Trade Barometer of 9 December signalled
continued trade expansion through the end of the year. However, the short-term outlook
for trade is clouded by rising global trade tensions.
Regional
trade volume performance
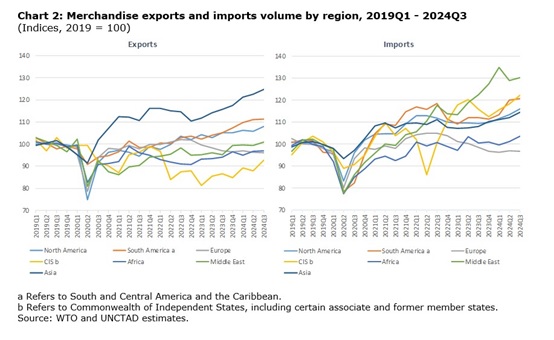
In
the third quarter of 2024, quarterly merchandise trade volume growth was positive
in most regions, with the important exception of Europe (see Chart 2).
The
Commonwealth of Independent States, including certain associate and former member
states, recorded the largest quarter-on-quarter increase in exports at 5.4%. North
America followed with a 2.1% rise, while Asia and the Middle East respectively posted
gains of 1.6% and 1.5%. South and Central America and the Caribbean saw modest export
growth of 0.2%, while shipments from Africa only grew a fraction of a percent (0.1%).
The
CIS region also led on the import side with a 3.3% quarter-on-quarter rise in Q3,
followed by Africa at 2.5% and North America at 2.3%. Asia recorded a 2.0% increase,
while the Middle East posted a 1.0% gain. South and Central America saw its imports
grow just 0.6% in the latest quarter.
Europe
was the only region to record negative export and import volume growth, ‑0.2%
and ‑0.3% respectively, as manufacturing continued to experience a prolonged
downturn.
Europe’s
trade performance in the first three quarters of 2024 was slightly worse than the
WTO's October forecast for 2024. The region's exports during this period were down
1.8% year-on-year, while imports fell 3.3%. These contractions were slightly worse
than the projected declines of 1.4% for exports and 2.3% for imports for the year.
Trade
in value terms
Latest
figures in value terms through September show robust growth in most Asian and Latin
American economies, with some notable exceptions (see Chart 3).
The
strongest export performance was recorded by Argentina, which saw a 17% surge in
goods shipments despite uncertainty related to its economic reforms. Viet Nam also
stood out for the strength of its exports, which were up 15% compared to the same
period in 2023. Other large economies saw more modest increases, including China
(5%) and the United States (3%). Extra-EU exports were up just 1% year-on-year while
exports were down in Japan (-2%) and the United Kingdom (-5%).
Viet
Nam had the strongest import growth, with a 17% year-on-year increase, balancing
its strong export performance. Other Asian economies saw imports rise sharply, including
Malaysia (13%), Chinese Taipei (9%), and Singapore (7%). The United States saw a 5% rise in imports, while
China's imports were only up 2%. By contrast, extra-EU imports fell 5%, while those
of Japan dropped 6%. Among other reporting economies, Argentina saw the sharpest
decline in imports, which plunged 22% amidst a continuing economic crisis.

Quarterly
and monthly statistics presented above are estimates as of time of publication and
subject to frequent revisions. They are available for download at WTO Stats. Additional
annual trade data and visualizations can be accessed at WTO | World Trade Statistics
2023.