Exports Grow Marginally by 3.74% in Jan, Imports too Slow Down
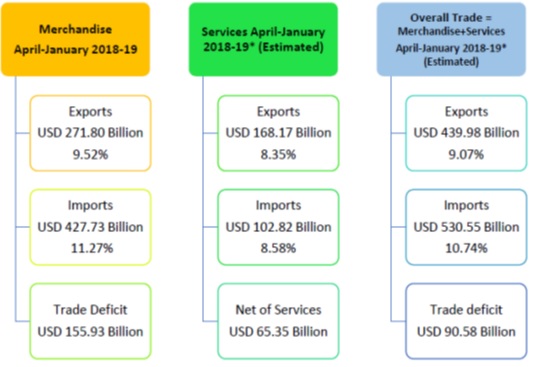
India’s overall exports (Merchandise
and Services combined) in April-January 2018-19* are estimated to be USD
439.98Billion, exhibiting a positive growth of 9.07per
cent over the same period last year. Overall imports in April-January2018-19*
are estimated to be USD 530.55Billion, exhibiting a positive
growth of 10.74per cent over the same period last year.
*Note: Services data pertains to
April-December 2018-19 as December 2018 is the latest data available as per
RBI’s Press Release dated 15th February 2019. It is
arrived at by adding quarterly data of RBI for Q1 & Q2 of 2018-19 with
Month-wise QE data of RBI’s press release for October to December 2018-19. This
data is provisional and subject to revision by RBI. In addition, it may be noted that data for January 2019 is estimated and
added to the April-December 2018-19 data of RBI to calculate the Overall Trade
Deficit for April-January 2018-19. It will be revised based on RBI’s next press
release for January 2019.
I.
Merchandise Trade
Exports (including re-exports)
Exports in January 2019 were US $ 26.36
Billion, as compared to US $ 25.41 Billion in January 2018, exhibiting a positive growth of 3.74 per cent. In Rupee terms, exports
were Rs. 1,86,453.23Crore in
January 2019, as compared to Rs. 1,61,697.38Crore in
January 2018, registering a positive growth of 15.31per cent.
In January 2019, major commodity groups
of export showing positive growth over the
corresponding month of last year are:
·
Engineering
Goods (1.07%)
·
Gems
& Jewellery (6.67%)
·
Organic
& Inorganic Chemicals (15.56%)
·
Drugs
& Pharmaceuticals (15.2%)
·
RMG
of all Textiles (9.33%)
Cumulative value of exports for the
period April-January 2018-19 was US $ 271.80Billion (Rs.18,98,358.83
Crore) as against US $ 248.18Billion (Rs.15,98,311.63 Crore) during the period
April-January 2017-18, registering a positive growth of 9.52per cent in Dollar
terms (18.77per cent in Rupee terms).
Non-petroleum and Non Gems and Jewellery exports in January 2019 were US $ 19.90Billion,
as compared to US $ 18.40Billion in January 2018, exhibiting a positive growth of 8.17per cent. Non-petroleum and Non Gems
and Jewellery exports in April-January 2018-19 were
US $ 197.56Billion, as compared to US $ 183.05Billion for the corresponding
period in 2017-18, an increase of 7.92per cent.
Imports
Imports in January 2019 were US $
41.09Billion (Rs. 2,90,611.86
Crore), which was 0.01per cent higher in Dollar terms and 11.16per cent higher
in Rupee terms over imports of US $ 41.08Billion (Rs.2,61,441.48Crore) in
January 2018. Cumulative value of imports for the period April-January 2018-19
was US $ 427.73Billion (Rs.29,87,918.68 Crore), as
against US $ 384.42Billion (Rs.24,75,812.40Crore) during the period
April-January 2017-18, registering a positive growth of 11.27per cent in Dollar
terms (20.68per cent in Rupee terms).
Major commodity groups of import
showing negative growth in January 2019 over the corresponding month of last
year are:
·
Petroleum,
Crude & products (-3.59%)
·
Transport
equipment (-21.43%)
·
Pearls,
precious & Semi-precious stones (-36.51%)
·
Vegetable
Oil (-19.89%)
·
Metaliferrous ores & other minerals (-48.87%)
Crude Oil and Non-Oil Imports:
Oil imports in January 2019 were US $
11.24Billion (Rs. 79,508.06 Crore), which was
3.59percent lower in Dollar terms (7.16percent higher in Rupee terms), compared
to US $ 11.66Billion (Rs. 74,195.96Crore) in January
2018. Oil imports in April-January 2018-19 were US $ 119.34Billion (Rs. 8,34,763.84 Crore) which was
36.65 per cent higher in Dollar terms (48.45 percent higher in Rupee terms)
compared to US $ 87.33Billion (Rs. 562,321.87 Crore),
over the same period last year.
In this connection it is mentioned that
the global Brent price ($/bbl) has decreased by
14.09% in January 2019 vis-à-vis January 2018 as per data available from World
Bank (Pink Sheet).
Non-oil imports in January 2019 were
estimated at US $ 29.85Billion (Rs.2,11,103.80 Crore)
which was 1.43 per cent higher in Dollar terms (12.74 percent higher in Rupee
terms), compared to US $ 29.42 Billion (Rs.
187,245.52 Crore) in January 2018. Non-oil imports in April-January 2018-19
were US $ 308.39 Billion (Rs.21,53,154.84Crore) which was 3.80 per cent higher
in Dollar terms (12.52percent higher in Rupee terms), compared to US $ 297.09
Billion (Rs. 19,13,490.53Crore) in April-January2017-18.
Non-Oil and Non-Gold imports were US $
27.53billion in January 2019, recording a negative growth of 0.78per cent, as
compared to Non-Oil and Non-Gold imports in January 2018. Non-Oil and Non-Gold
imports were US $ 281.42billion in April-January 2018-19, recording a positive growth of 4.69per cent, as compared to Non-Oil and
Non-Gold imports in April-January 2017-18.
II. Trade in Services (for December, 2018, as per the RBI Press Release dated 15th
February 2019)
Exports (Receipts)
Exports inDecember2018 were US $ 17.93
Billion (Rs.1,26,799.64 Crore) registering a positive
growth of 7.50 per cent in dollar terms, vis-à-vis November 2018. (as per RBI’s Press Release for the respective months).
Imports (Payments)
Imports inDecember2018 were US $ 11.38
Billion (Rs.80,463.70Crore) registering a positive
growth of 12.53 per cent in dollar terms,vis-à-vis
November 2018. (as
per RBI’s Press Release for the respective months).
III. Trade Balance
Merchandise: The trade deficit for January 2019 was
estimated at US $ 14.73Billion as against the deficit of US $
15.67Billion in January 2018.
Services: As per RBI’s Press Release dated 15th
February 2019, the trade balance in Services (i.e. Net Services export) for
December, 2018 is estimated at US $ 6.55Billion.
Overall Trade Balance: Taking merchandise and services together, overall trade
deficit for April-January 2018-19* is estimated at US $ 90.58 Billion as
compared to US $ 75.73 Billion in April-January 2017-18.
*Note: Services data pertains to
April-December 2018-19 as December 2018 is the latest data available as per
RBI’s Press Release dated 15th February 2019. It is
arrived at by adding quarterly data of RBI for Q1 & Q2 of 2018-19 with
Month-wise QE data of RBI’s press release for October to December 2018-19. This
data is provisional and subject to revision by RBI. In addition, it may be noted that data for January 2019 is estimated and
added to the April-December 2018-19 data of RBI to calculate the Overall Trade
Deficit for April-January 2018-19. It will be revised based on RBI’s next press
release for January 2019.
|
Merchandise
Trade |
||
|
Exports &
Imports: (US $ Billion) |
||
|
(Provisional) |
||
|
|
January |
April-January |
|
Exports (including
re-exports) |
|
|
|
2017-18 |
25.41 |
248.18 |
|
2018-19 |
26.36 |
271.80 |
|
%Growth 2018-19/
2017-18 |
3.74 |
9.52 |
|
Imports |
|
|
|
2017-18 |
41.08 |
384.42 |
|
2018-19 |
41.09 |
427.73 |
|
%Growth 2018-19/
2017-18 |
0.01 |
11.27 |
|
Trade Balance |
|
|
|
2017-18 |
-15.67 |
-136.25 |
|
2018-19 |
-14.73 |
-155.93 |
Services Trade
Exports
& Imports (Services) : (US $ Billion)
|
(Provisional) |
December 2018 |
April-December
2018-19 |
|
Exports (Receipts) |
17.93 |
149.69 |
|
Imports (Payments) |
11.38 |
90.91 |
|
Trade Balance |
6.55 |
65.35 |
|
Exports &
Imports (Services): (Rs. Crore) |
|
|
|
(Provisional) |
December 2018 |
April-December
2018-19 |
|
Exports (Receipts) |
1,26,799.64 |
10,58,752.62 |
|
Imports (Payments) |
80,463.70 |
6,42,988.14 |
|
Trade Balance |
46,335.94 |
4,62,240.62 |
Note: Services data pertains to
April-December 2018-19 as December 2018 is the latest data available as per
RBI’s Press Release dated 15thFebruary 2019. April-December 2018-19
data is arrived at by adding quarterly data of RBI for Q1 & Q2 of 2018-19
with Month-wise QE dataof RBI’s press release for October
to December 2018-19. This has been used along with the
estimate of service exports and imports for January 2019, as explained in
page-1 for the purpose of this Press note.